Skip to content
25% off all pet accessories | Automatically Applied At Checkout | FREE STANDARD SHIPPING!
Your browser does not support HTML5 video.
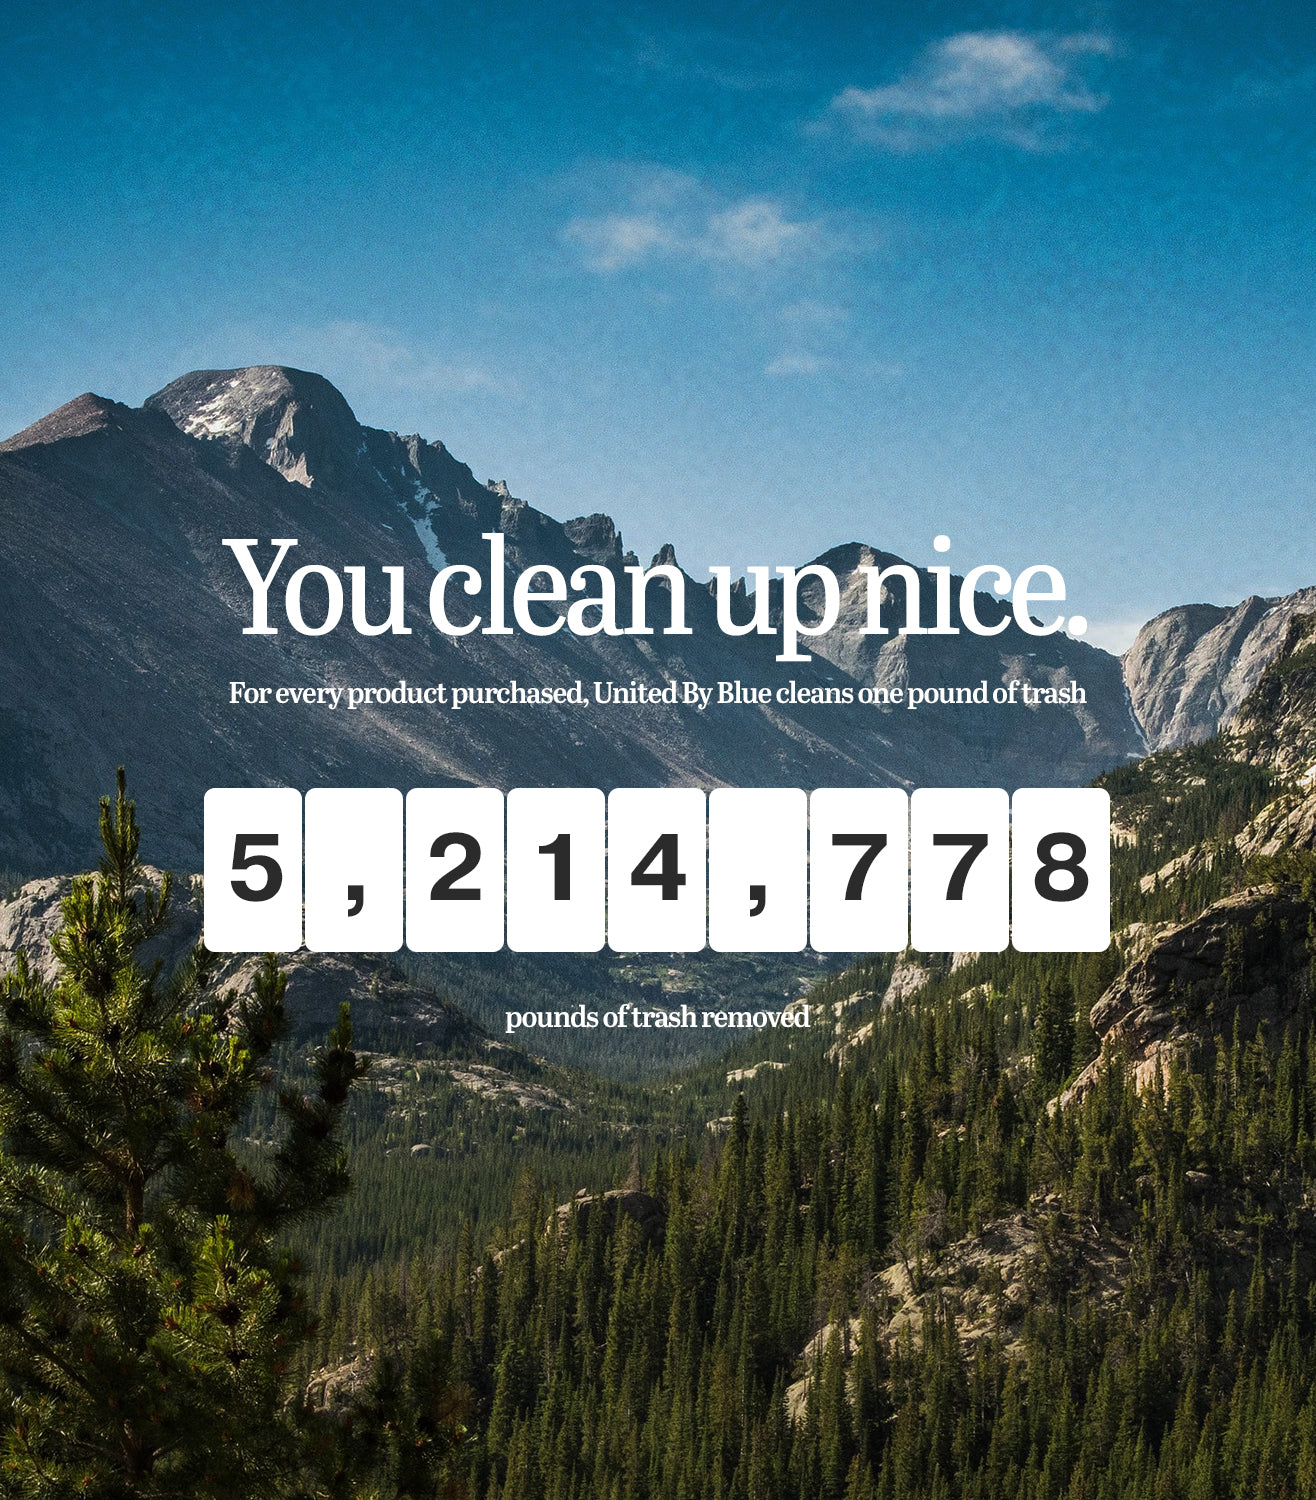
For every product purchased, United by Blue removes one pound of trash from oceans and waterways.
pounds of trash removed
Open Menu
Go to Homepage
Bags
Collections
(R)evolution
(Re)active
Shop By Style
Backpacks
Tote Bags
Fanny Packs
Crossbody
Duffle Bags
New Arrivals
Best Sellers
Accessories
Accessories
Bottles
Socks
Hats
Scarves & Bandanas
Pets
Bison
Reusables
Household
Mugs
Ceramics
Drinkware
Water Bottles & Reusables
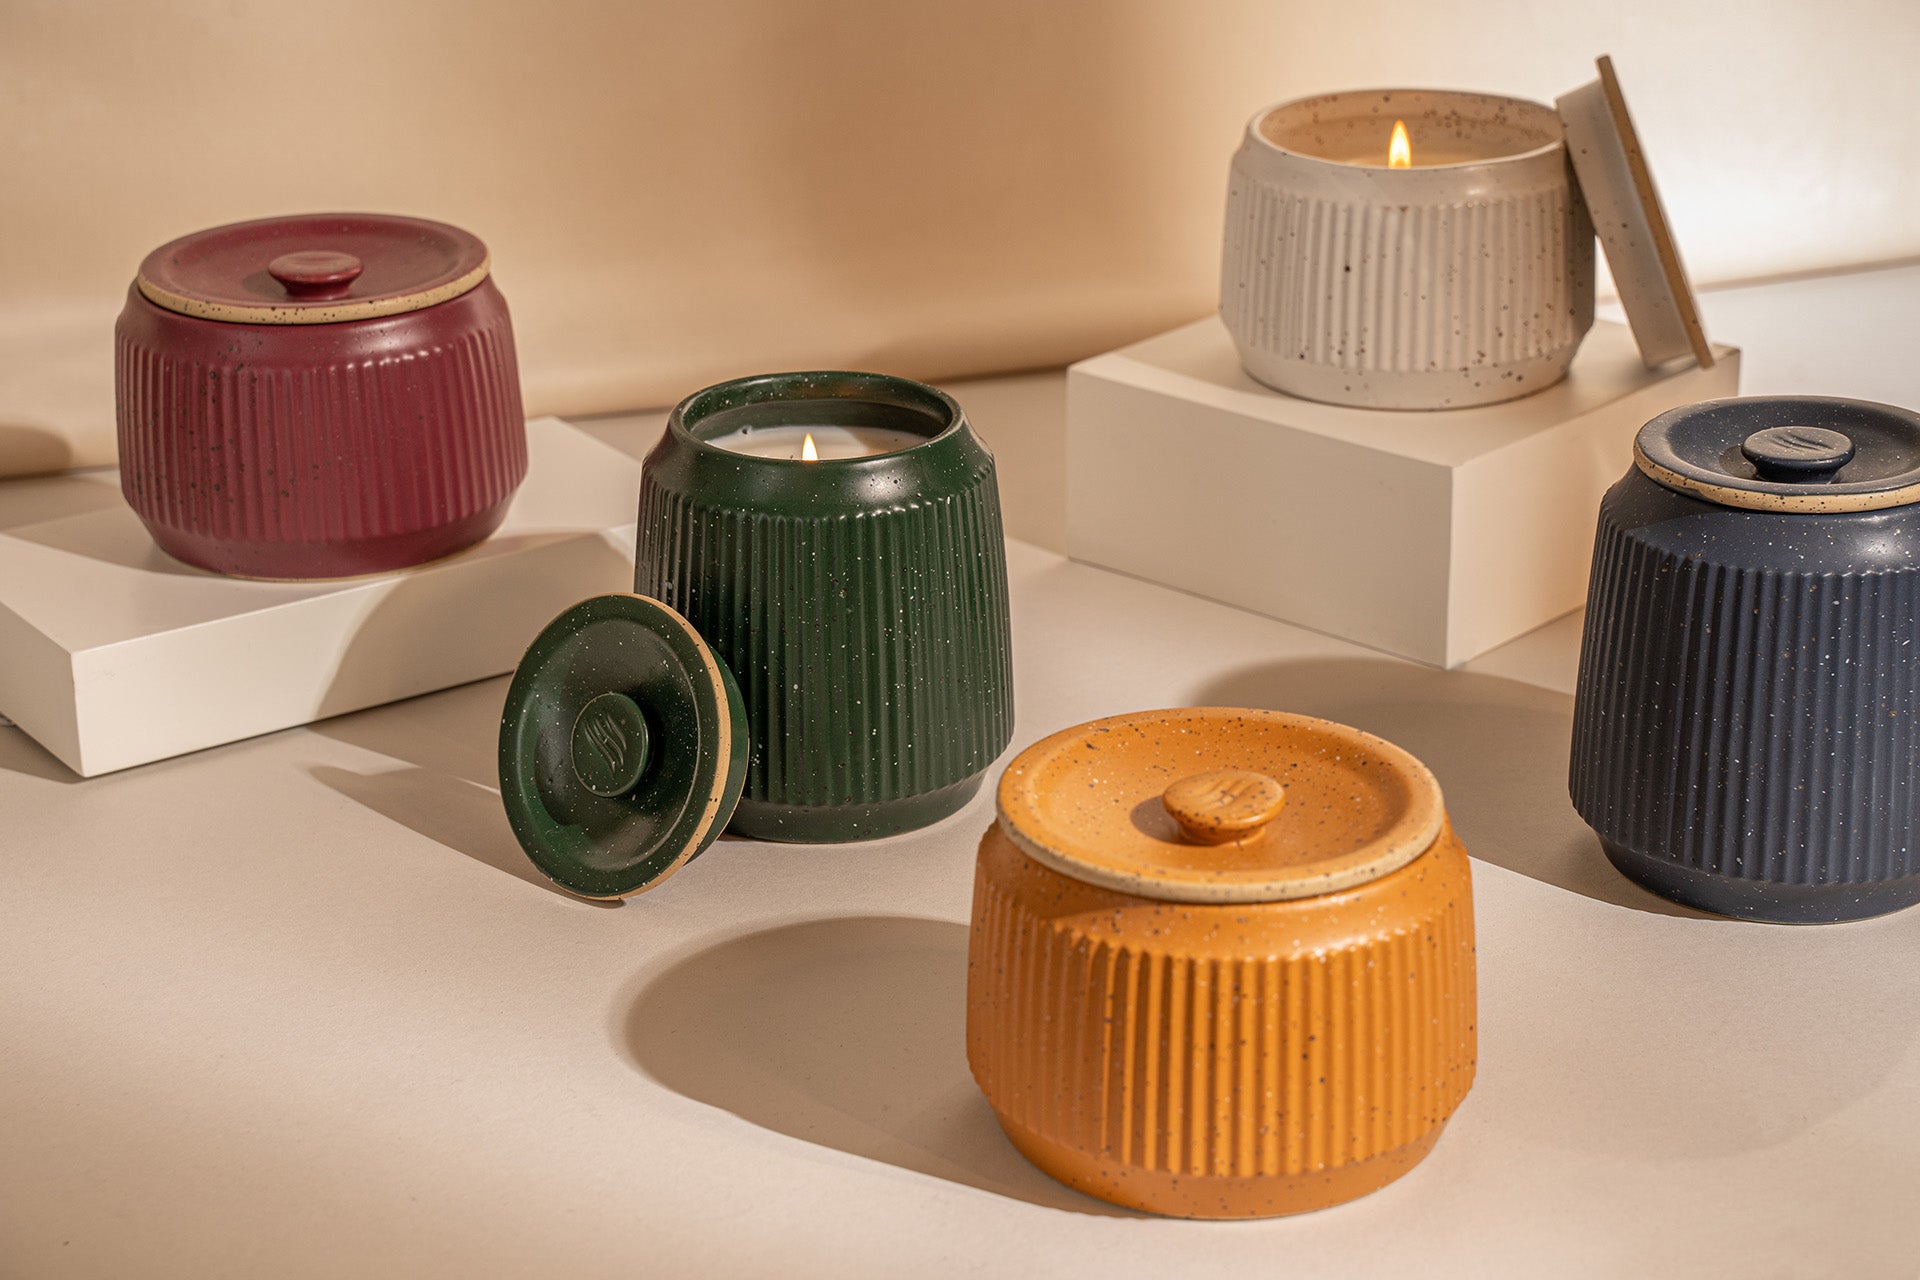
Candles
Apparel
Women
All Women's Apparel
Outerwear
Bison
Men
All Men's Apparel
Outerwear
Bison
Mission
Overview
Product-for-Pound
Low Impact Materials
Ethical Manufacturing
Cleanups
Search
Close Menu
Search
Search
Bags
Accessories
Household
Apparel
Mission
Back to Menu
New Arrivals
Best Sellers
Collections
(R)evolution
(Re)active
Shop By Style
Backpacks
Tote Bags
Fanny Packs
Crossbody
Duffle Bags
Back to Menu
Accessories
Bottles
Socks
Hats
Scarves & Bandanas
Pets
Bison
Reusables
Back to Menu
Mugs
Ceramics
Drinkware
Water Bottles & Reusables
Candles
Back to Menu
Women
All Women's Apparel
Outerwear
Bison
Men
All Men's Apparel
Outerwear
Bison
Back to Menu
Overview
Product-for-Pound
Low Impact Materials
Ethical Manufacturing
Cleanups
Shop Now
Learn More About Our Mission
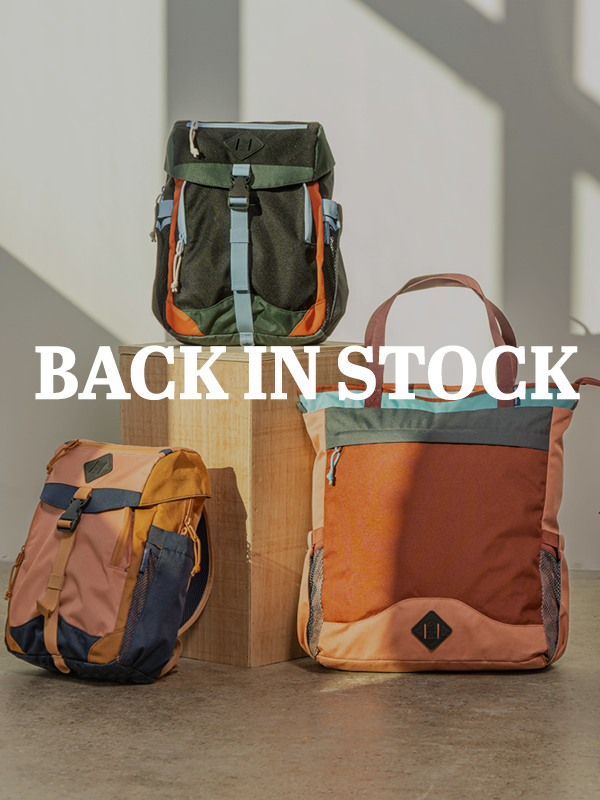
SHOP NOW
Planet Pooch: Where Sustainability Meets Wagging Tails!
ADD TO WISHLIST
CONTINUE SHOPPING
Product variants
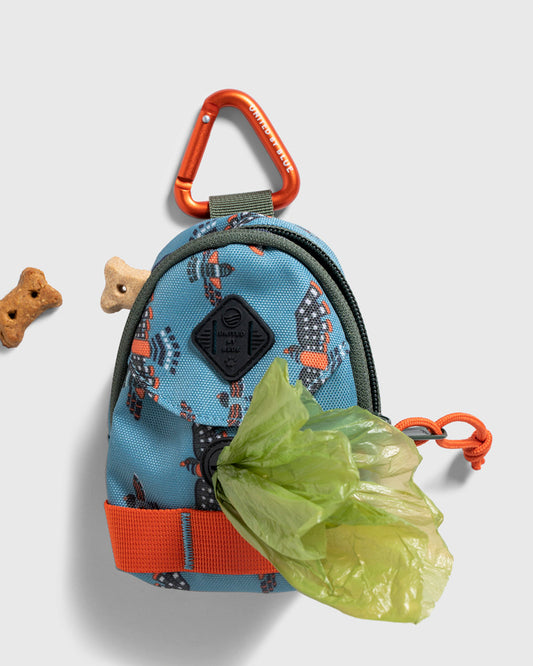
Night Mountain - Sold out - $24.00
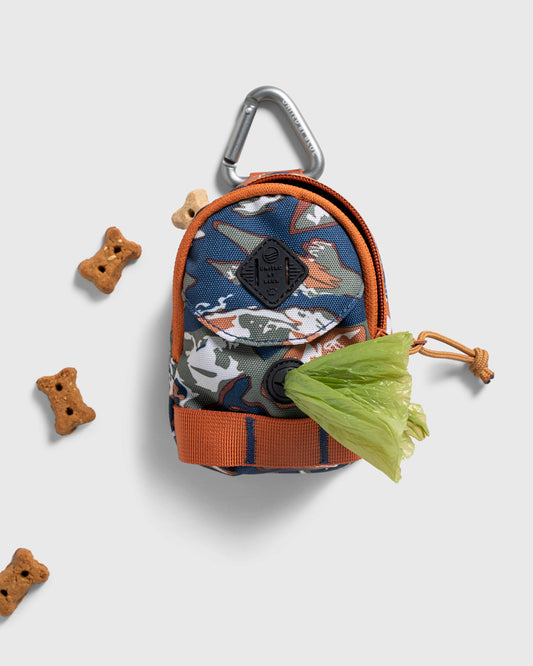
Sagebrush Green - $24.00
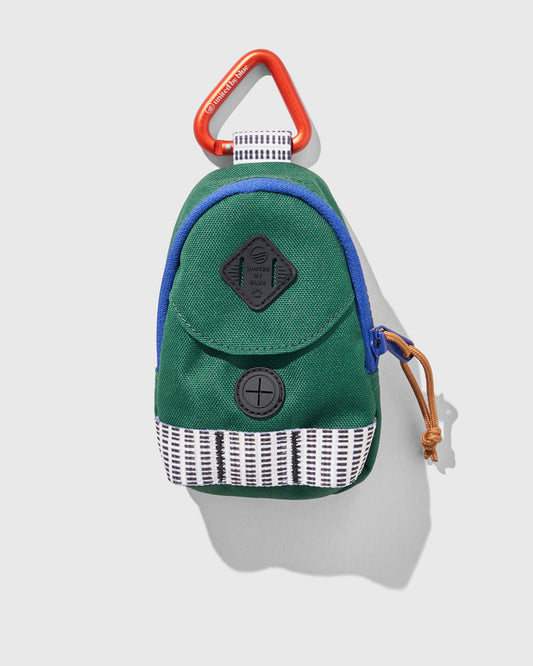
Pine - $24.00
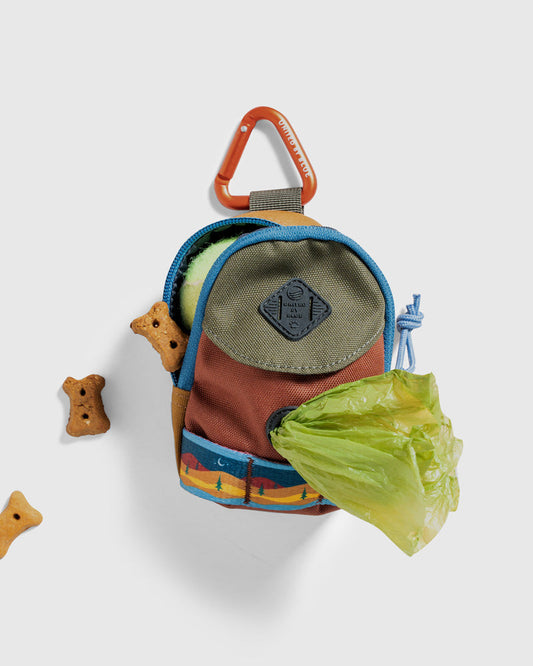
Lakeside Camo - $24.00
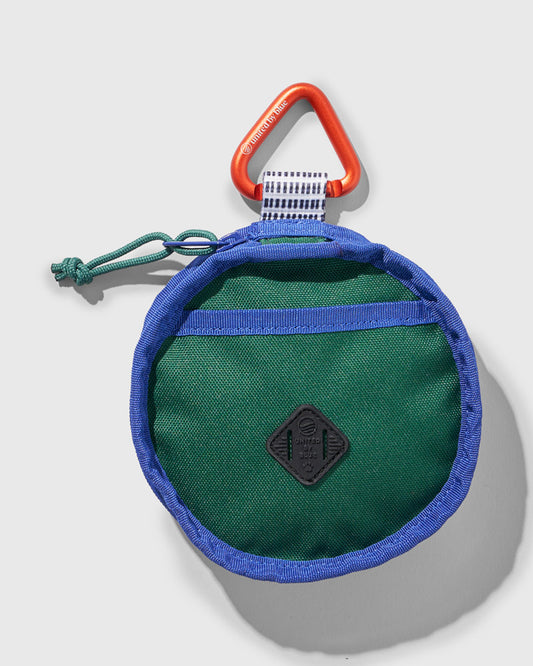
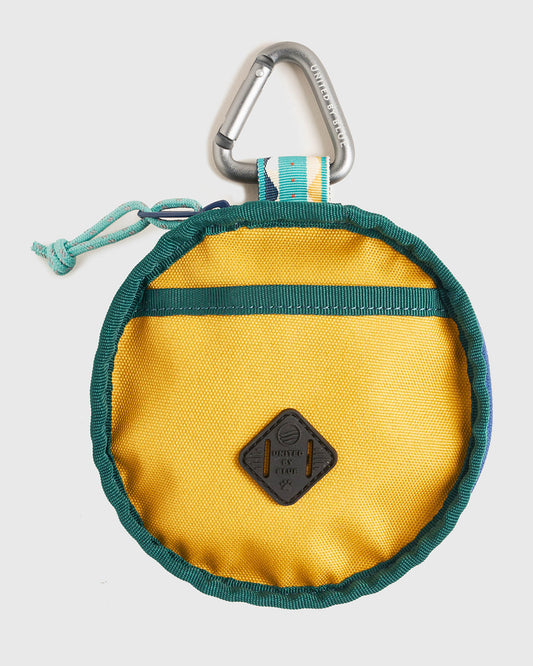
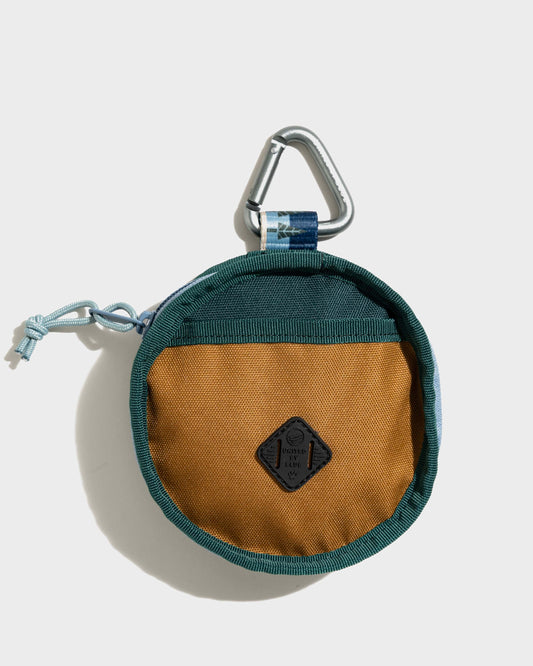
(R)evolution™ Dog Waste Bag Dispenser
(R)evolution™ Dog Waste Bag Dispenser
Regular price
$24
Regular price
$24.00
Sale price
$24
Unit price
/
per
Regular price
$24
Regular price
$24.00
Sale price
$24
Unit price
/
per
Regular price
$24
Regular price
$24.00
Sale price
$24
Unit price
/
per
Regular price
$24
Regular price
$24.00
Sale price
$24
Unit price
/
per
Out of stock
ADD TO WISHLIST
CONTINUE SHOPPING
Product variants
Sagebrush Green - $26.00
Pine - $26.00
Lakeside Camo - $26.00
Mustard - Sold out - $26.00
Honey - Sold out - $26.00
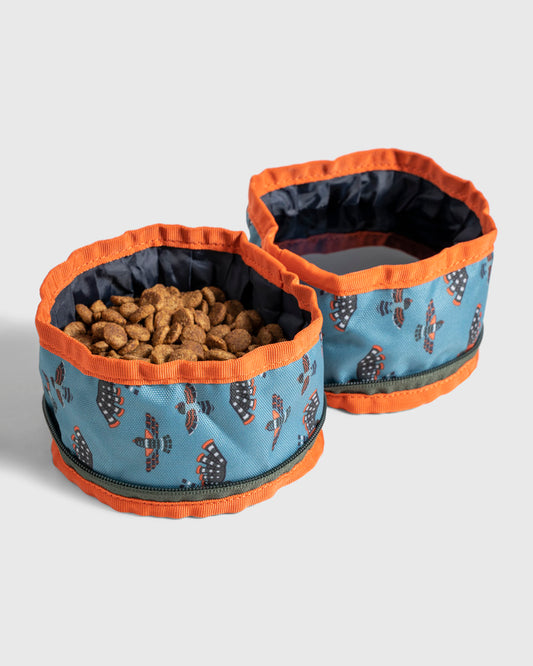
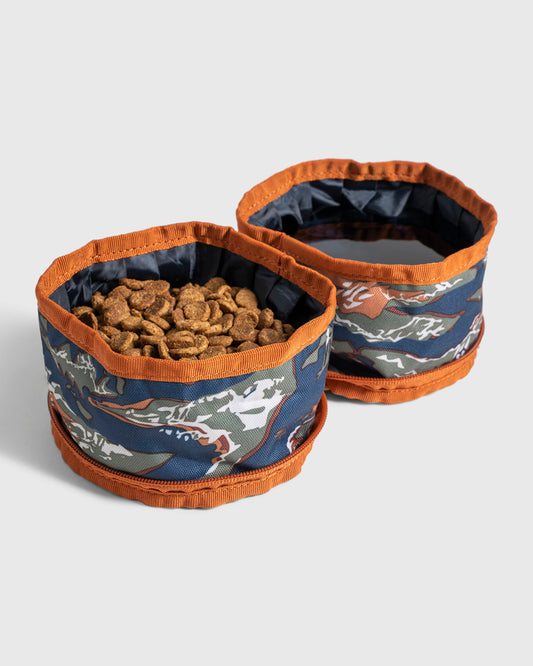
(R)evolution™ Collapsible Double Dog Bowl
(R)evolution™ Collapsible Double Dog Bowl
Regular price
$26
Regular price
$26.00
Sale price
$26
Unit price
/
per
Regular price
$26
Regular price
$26.00
Sale price
$26
Unit price
/
per
Regular price
$26
Regular price
$26.00
Sale price
$26
Unit price
/
per
Regular price
$26
Regular price
$26.00
Sale price
$26
Unit price
/
per
Regular price
$26
Regular price
$26.00
Sale price
$26
Unit price
/
per
Out of stock
Out of stock
ADD TO WISHLIST
CONTINUE SHOPPING
Product variants
Shortbread / S - $16.00
Shortbread / L - $16.00
Cortado / S - Sold out - $16.00
Cortado / L - Sold out - $16.00
Foxglove / S - Sold out - $16.00
Foxglove / L - Sold out - $16.00
Fresh Air / S - Sold out - $16.00
Fresh Air / L - Sold out - $16.00
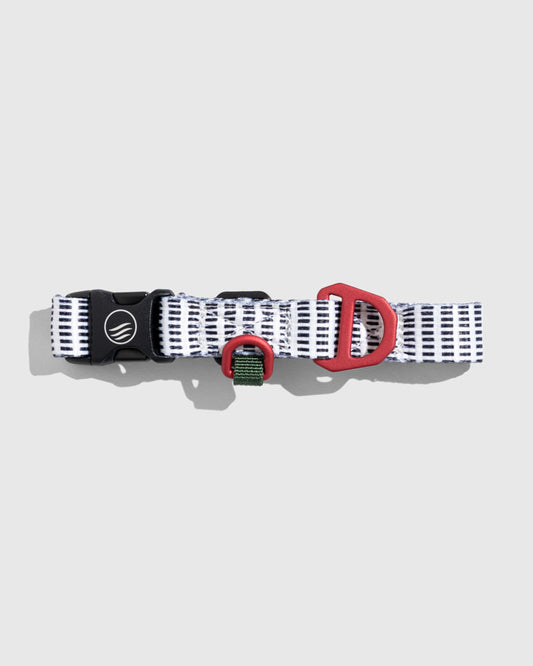
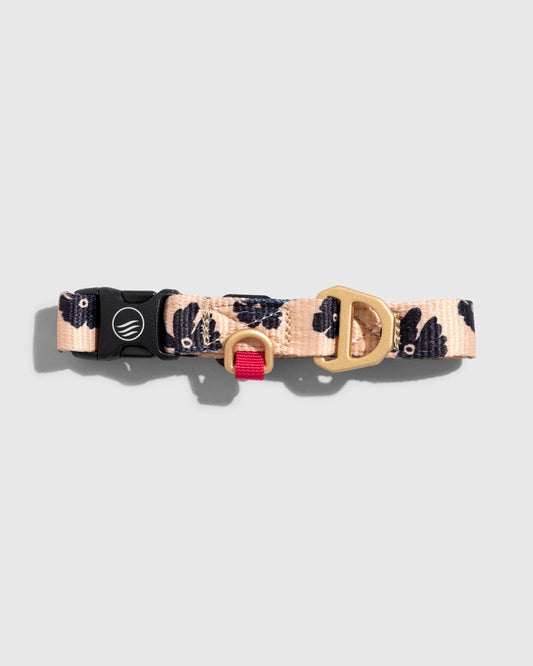
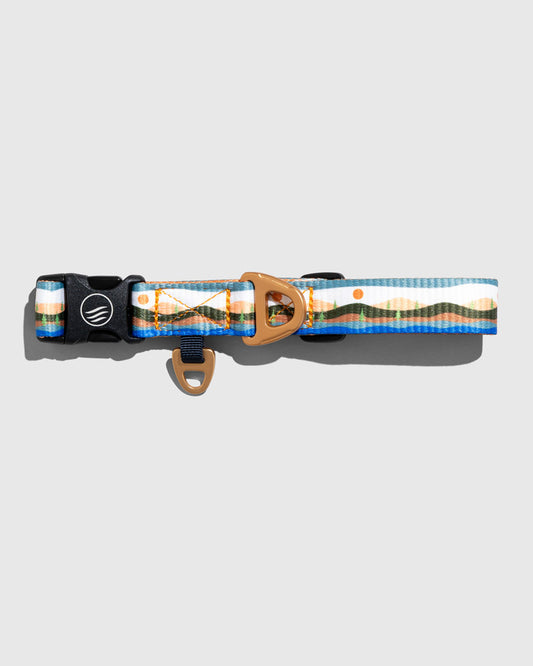
(R)evolution™ Recycled Woven Dog Collar
(R)evolution™ Recycled Woven Dog Collar
Regular price
$16
Regular price
$16.00
Sale price
$16
Unit price
/
per
Regular price
$16
Regular price
$16.00
Sale price
$16
Unit price
/
per
Regular price
$16
Regular price
$16.00
Sale price
$16
Unit price
/
per
Regular price
$16
Regular price
$16.00
Sale price
$16
Unit price
/
per
Regular price
$16
Regular price
$16.00
Sale price
$16
Unit price
/
per
Regular price
$16
Regular price
$16.00
Sale price
$16
Unit price
/
per
Regular price
$16
Regular price
$16.00
Sale price
$16
Unit price
/
per
Regular price
$16
Regular price
$16.00
Sale price
$16
Unit price
/
per
ADD TO WISHLIST
CONTINUE SHOPPING
Product variants
Shortbread / S - $28.00
Shortbread / L - $28.00
Wave Swoop / S - Sold out - $28.00
Wave Swoop / L - $28.00
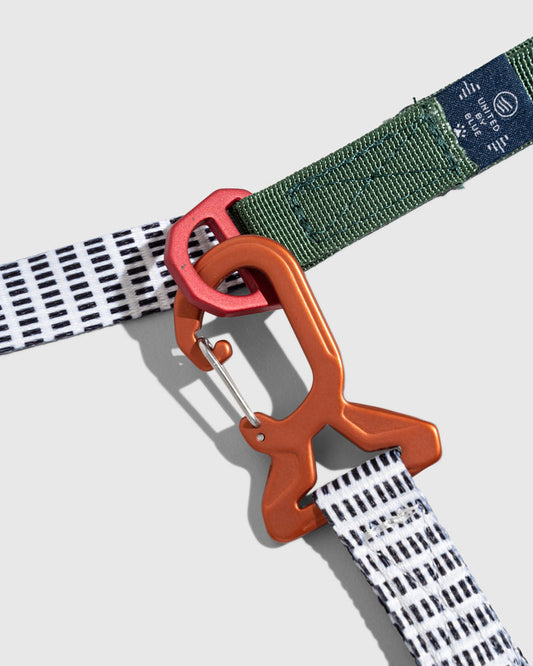
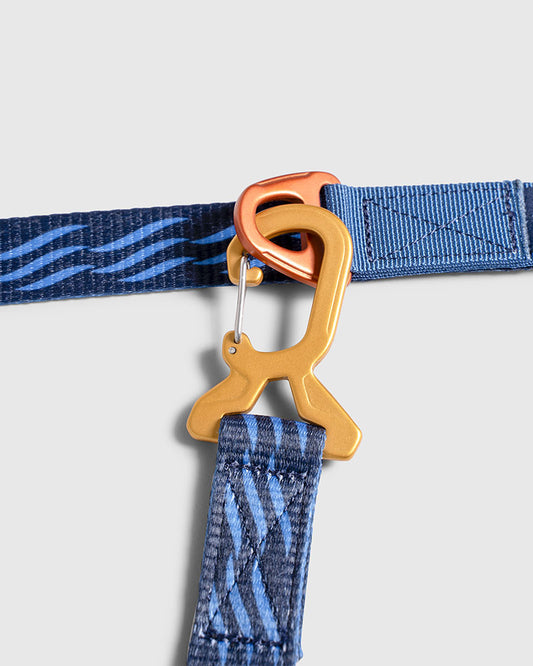
(R)evolution™ Recycled Woven Dog Leash
(R)evolution™ Recycled Woven Dog Leash
Regular price
$28
Regular price
$28.00
Sale price
$28
Unit price
/
per
Regular price
$28
Regular price
$28.00
Sale price
$28
Unit price
/
per
Regular price
$28
Regular price
$28.00
Sale price
$28
Unit price
/
per
Regular price
$28
Regular price
$28.00
Sale price
$28
Unit price
/
per
ADD TO WISHLIST
CONTINUE SHOPPING
Product variants
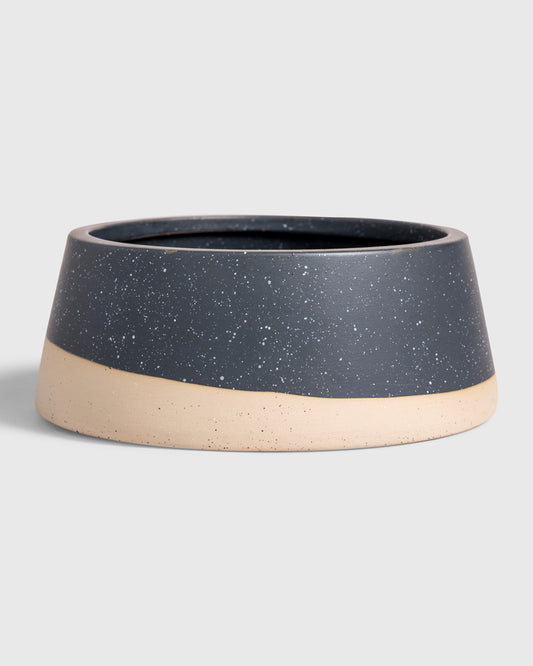
Black - $32.00
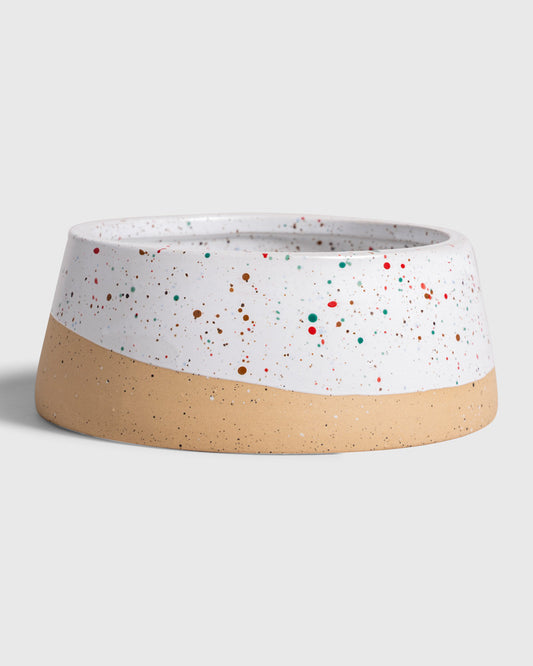
White - $32.00
Stoneware Dog Bowl
Selling Fast
Stoneware Dog Bowl
Regular price
$32
Regular price
$32.00
Sale price
$32
Unit price
/
per
Regular price
$32
Regular price
$32.00
Sale price
$32
Unit price
/
per
Our Featured Categories
All Bags
Shop Now
Backpacks
Shop Now
Water Bottles
Shop Now
Socks
Shop Now
Hats
Shop Now
Ceramics
Shop Now
Shop Now
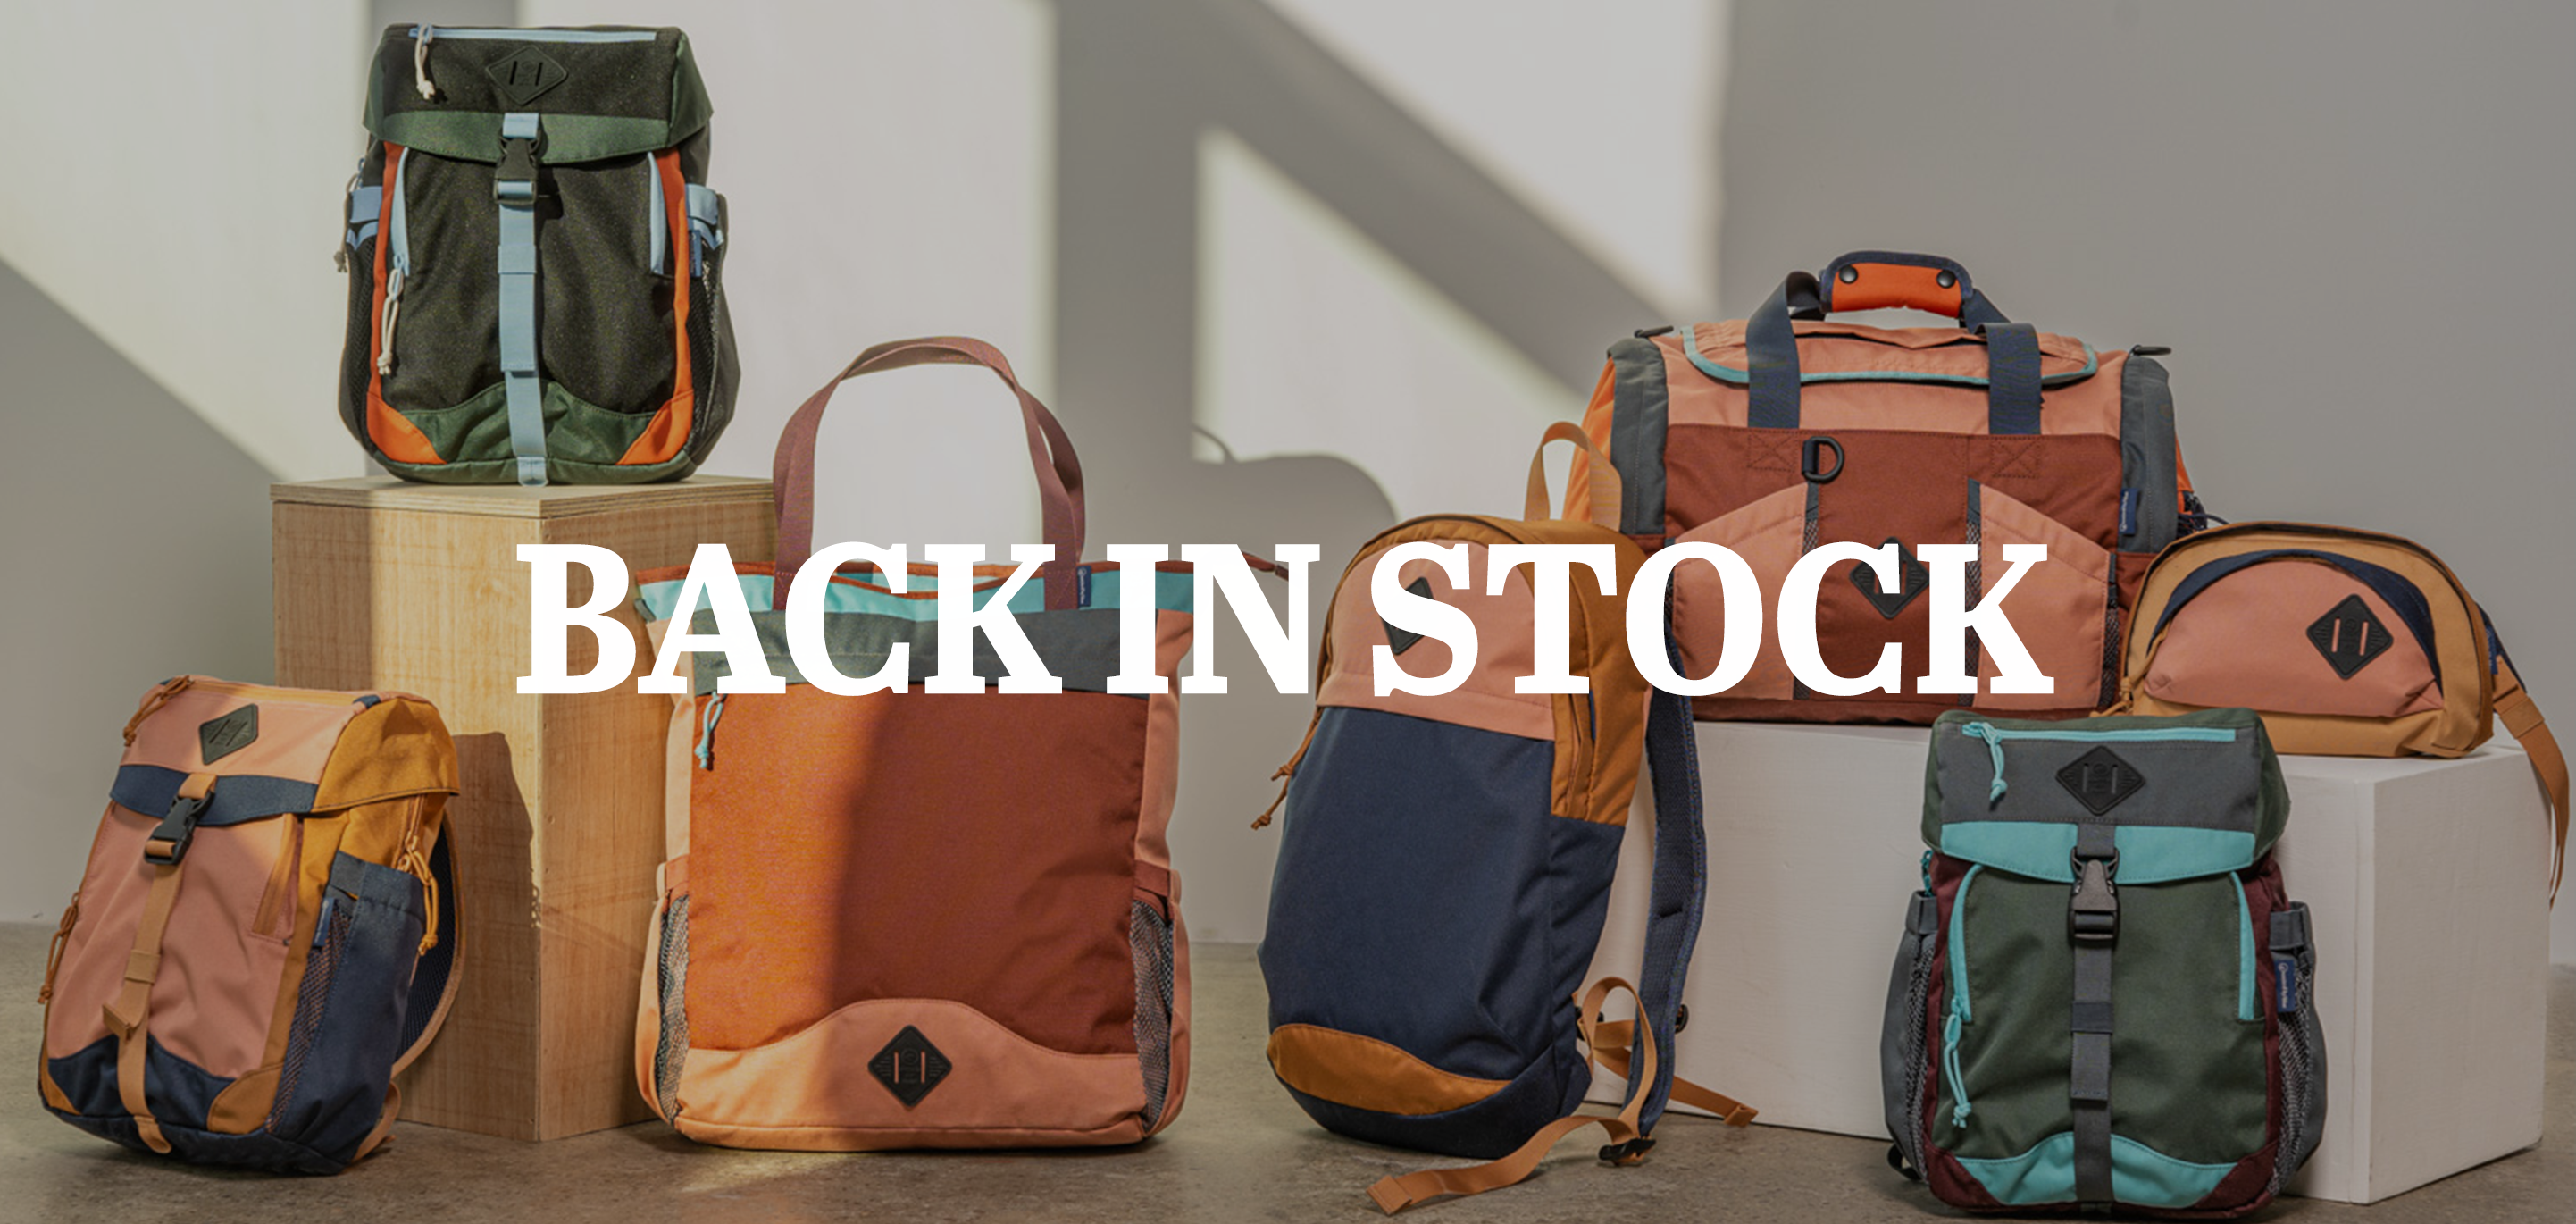
(R)evolution Bags
View all
ADD TO WISHLIST
CONTINUE SHOPPING
Product variants
Black Multi - $118.00
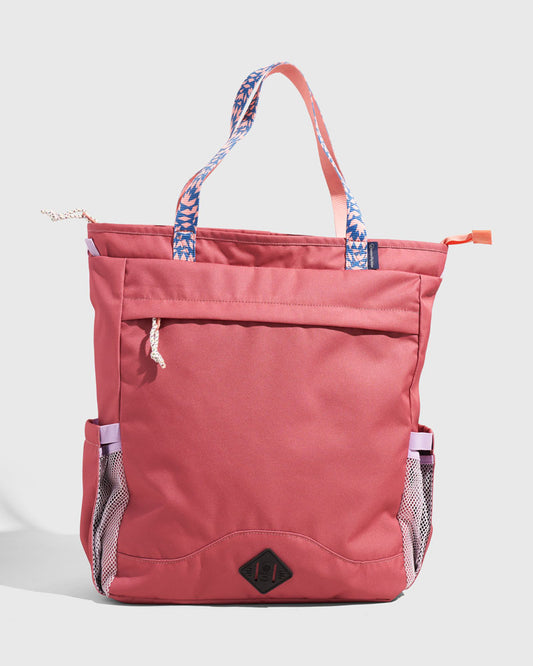
Mauve - $118.00
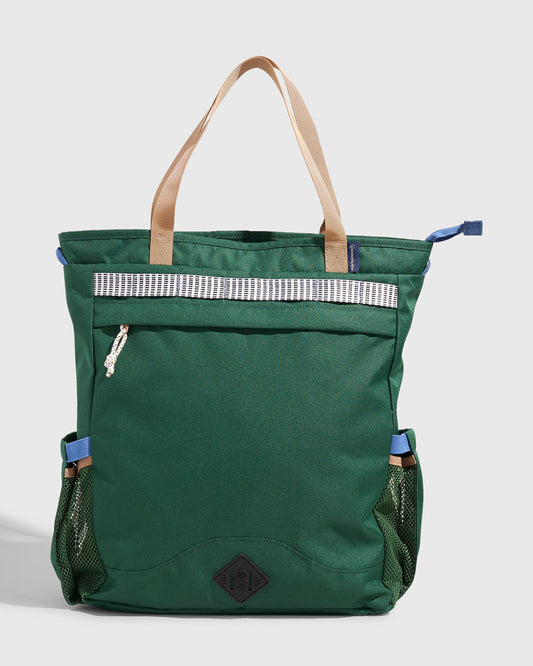
Pine - $118.00
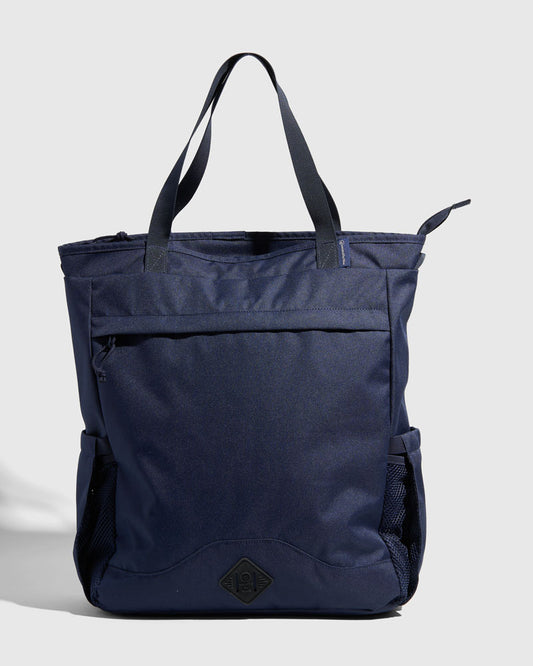
Navy - $118.00
Cortado - $118.00
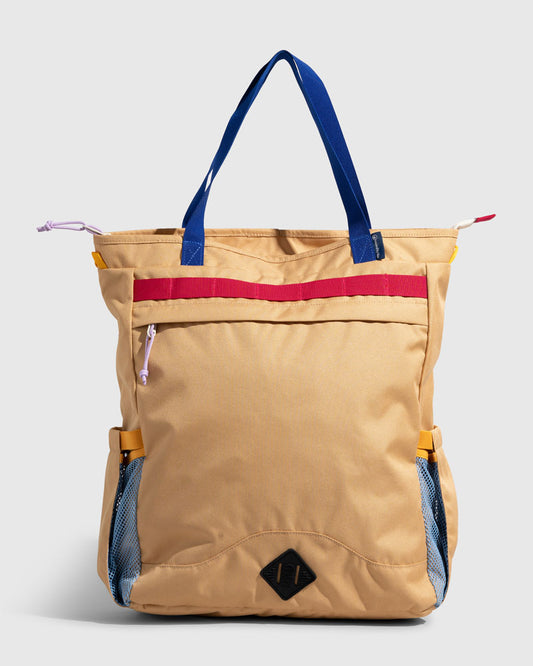
Camel - Sold out - $118.00
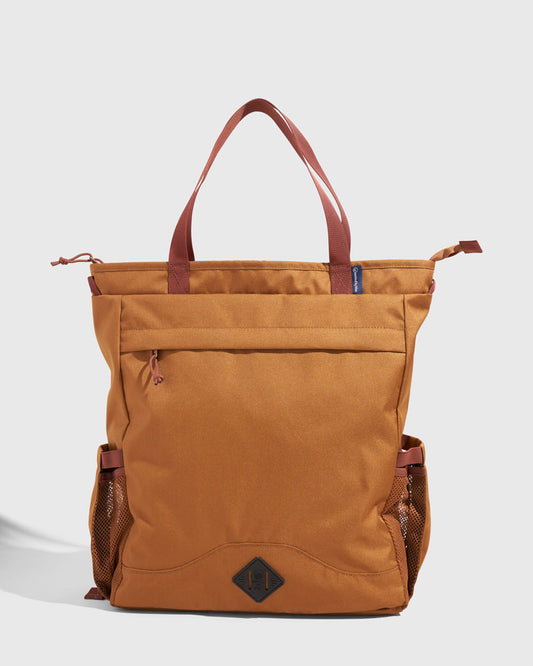
(R)evolution™ 25L Convertible Carryall
(R)evolution™ 25L Convertible Carryall
Regular price
$118
Regular price
$118.00
Sale price
$118
Unit price
/
per
Regular price
$118
Regular price
$118.00
Sale price
$118
Unit price
/
per
Regular price
$118
Regular price
$118.00
Sale price
$118
Unit price
/
per
Regular price
$118
Regular price
$118.00
Sale price
$118
Unit price
/
per
Regular price
$118
Regular price
$118.00
Sale price
$118
Unit price
/
per
Regular price
$118
Regular price
$118.00
Sale price
$118
Unit price
/
per
Out of stock
ADD TO WISHLIST
CONTINUE SHOPPING
Product variants
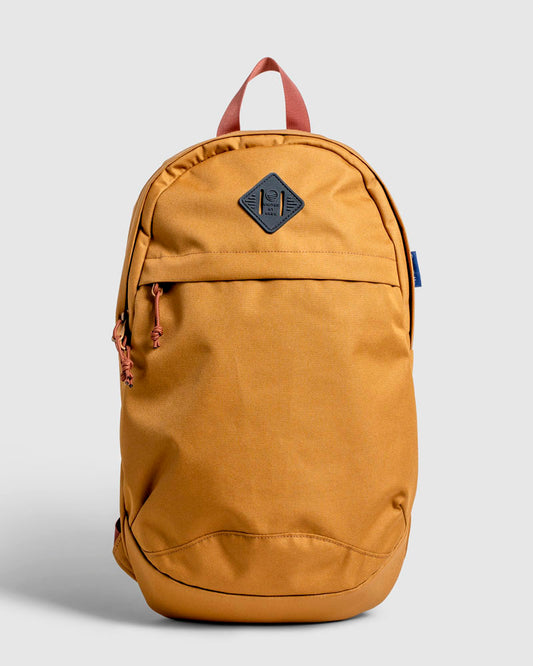
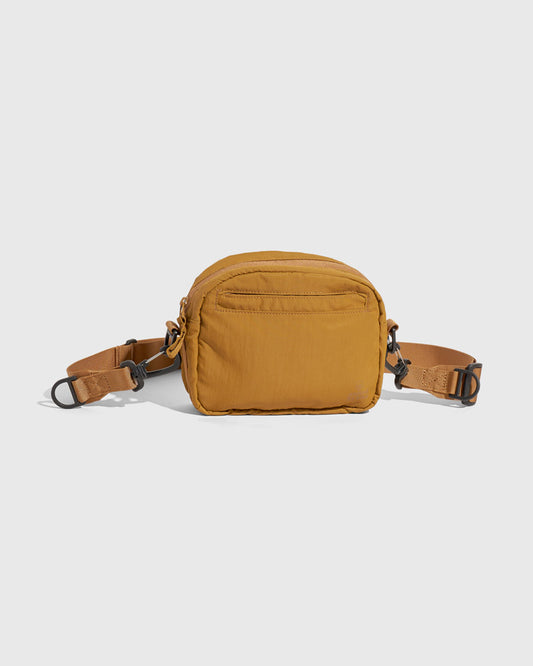
Camel - $88.00
Black Multi - $88.00
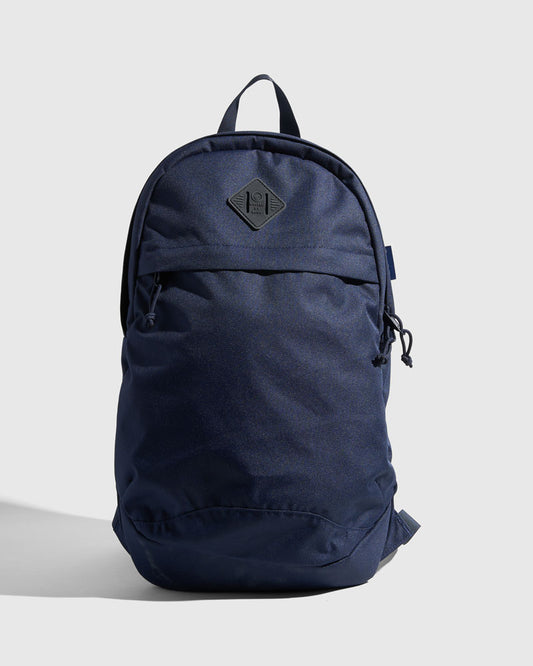
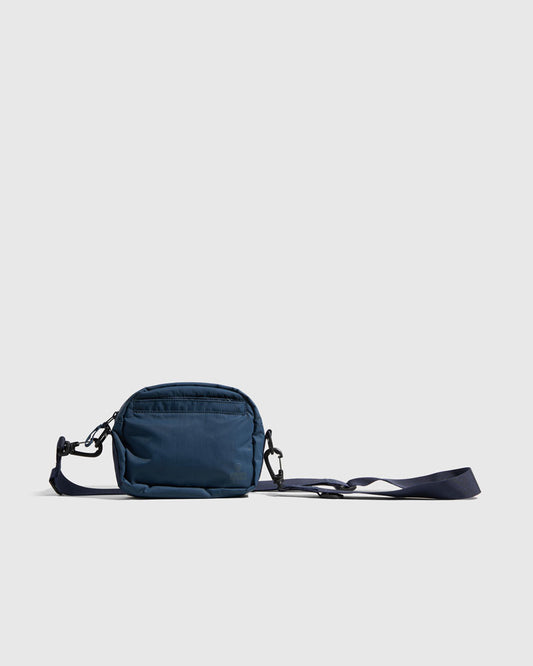
Navy - $88.00
Pine - $88.00
Mauve - $88.00
Lakeside Camo - Sold out - $88.00
Cortado - $88.00
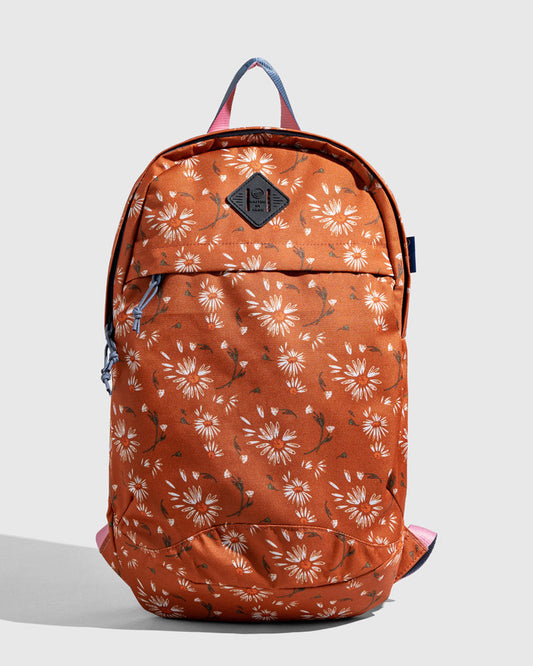
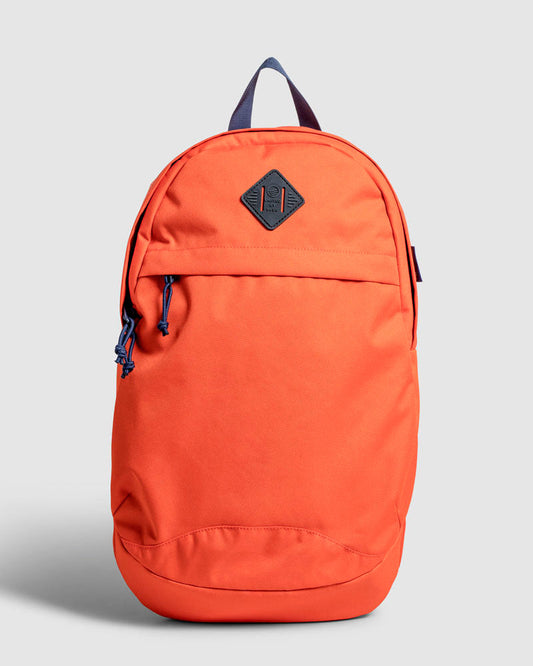
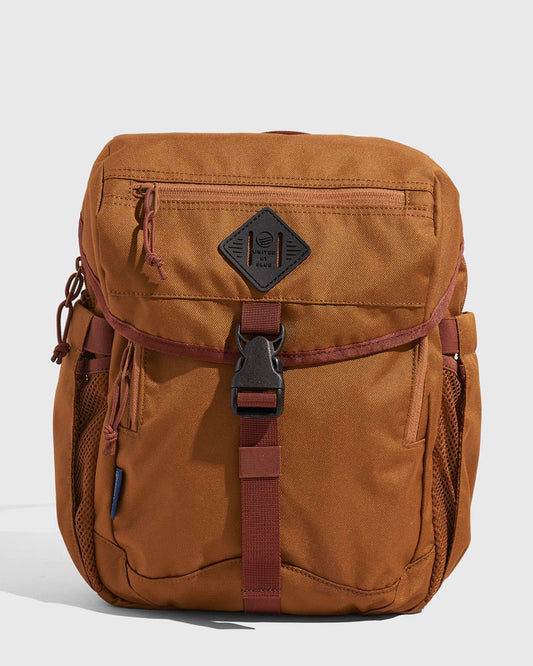
(R)evolution™ 9L Sidekick
(R)evolution™ 9L Sidekick
Regular price
$88
Regular price
Sale price
$88
Unit price
/
per
Regular price
$88
Regular price
Sale price
$88
Unit price
/
per
Regular price
$88
Regular price
Sale price
$88
Unit price
/
per
Regular price
$88
Regular price
Sale price
$88
Unit price
/
per
Regular price
$88
Regular price
Sale price
$88
Unit price
/
per
Regular price
$88
Regular price
Sale price
$88
Unit price
/
per
Regular price
$88
Regular price
Sale price
$88
Unit price
/
per
Out of stock
ADD TO WISHLIST
CONTINUE SHOPPING
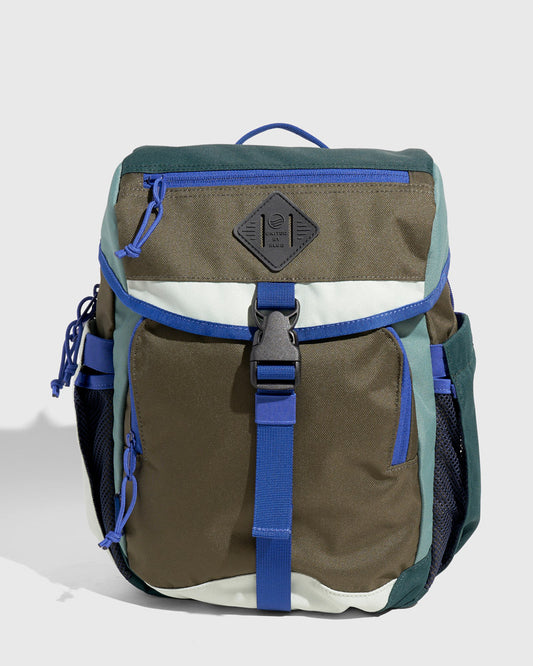
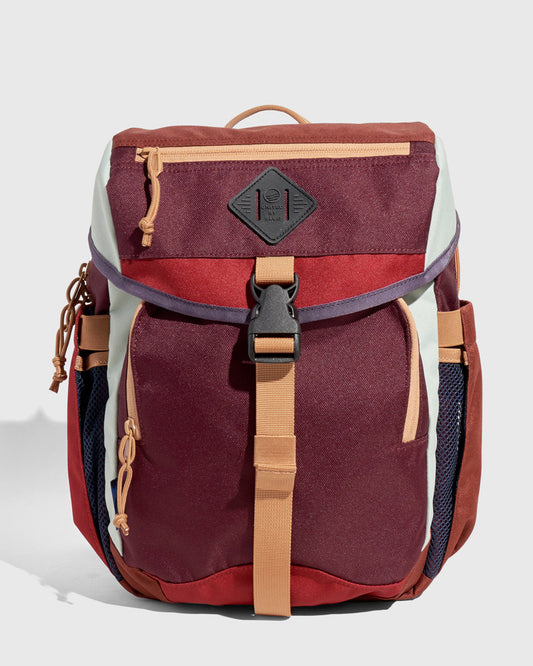
Product variants
Black Multi - $118.00
Camel - $118.00
Pine - $118.00
Navy - $118.00
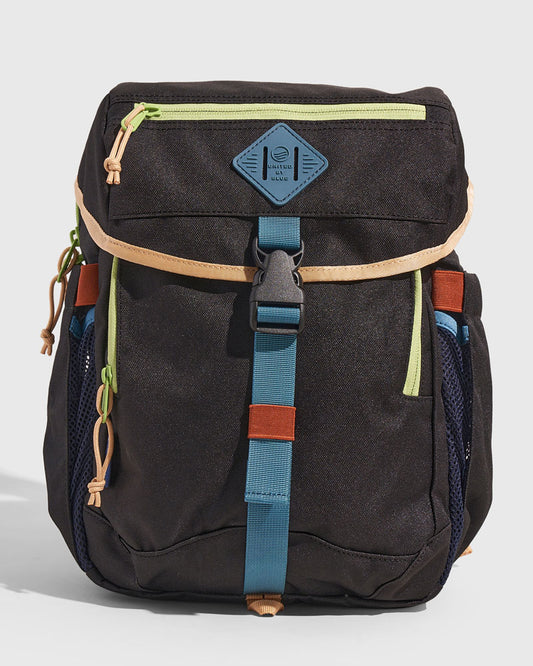
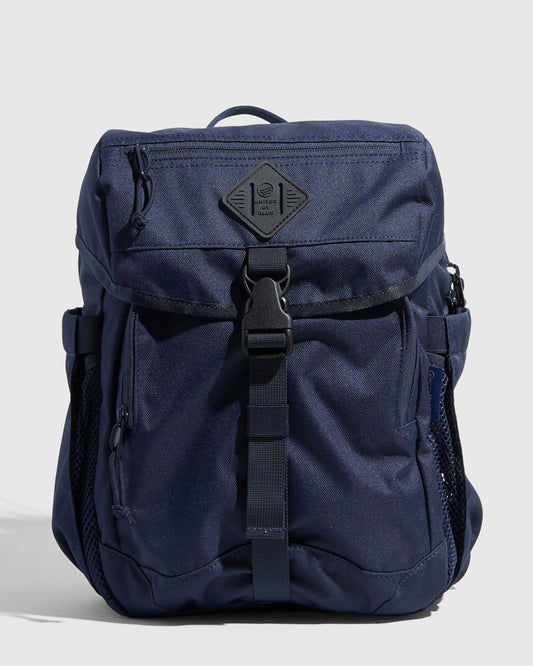
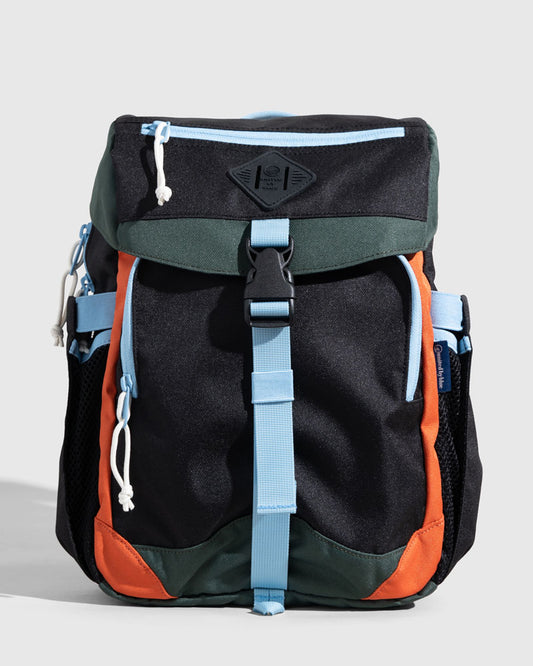
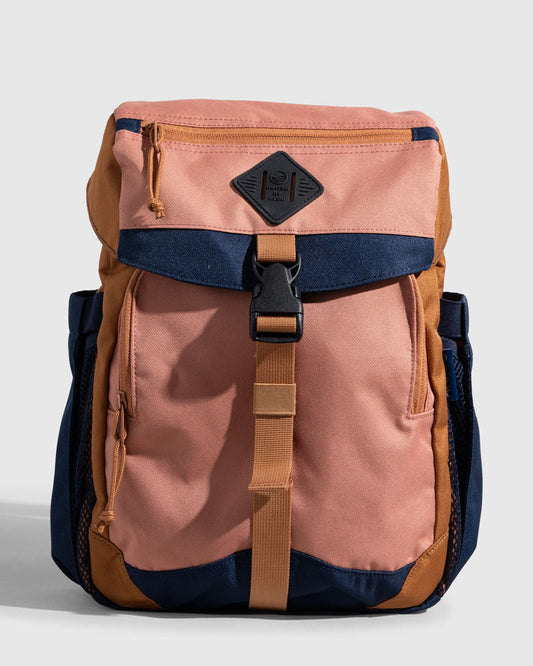
(R)evolution™ 25L Transit Pack
(R)evolution™ 25L Transit Pack
Regular price
$118
Regular price
$118.00
Sale price
$118
Unit price
/
per
Regular price
$118
Regular price
$118.00
Sale price
$118
Unit price
/
per
Regular price
$118
Regular price
$118.00
Sale price
$118
Unit price
/
per
Regular price
$118
Regular price
$118.00
Sale price
$118
Unit price
/
per
ADD TO WISHLIST
CONTINUE SHOPPING
Product variants
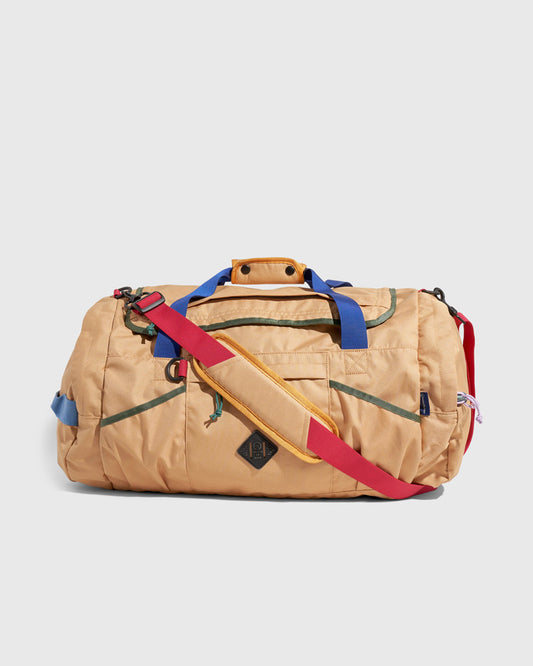
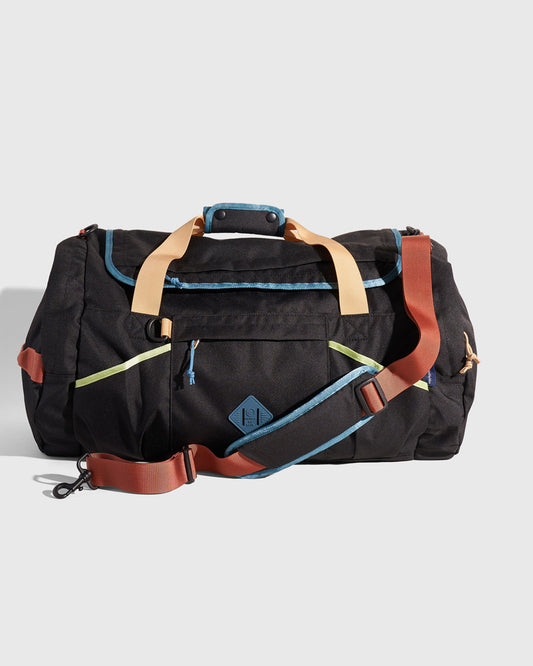
Camel - $148.00
Cortado - $148.00
Black Multi - $148.00
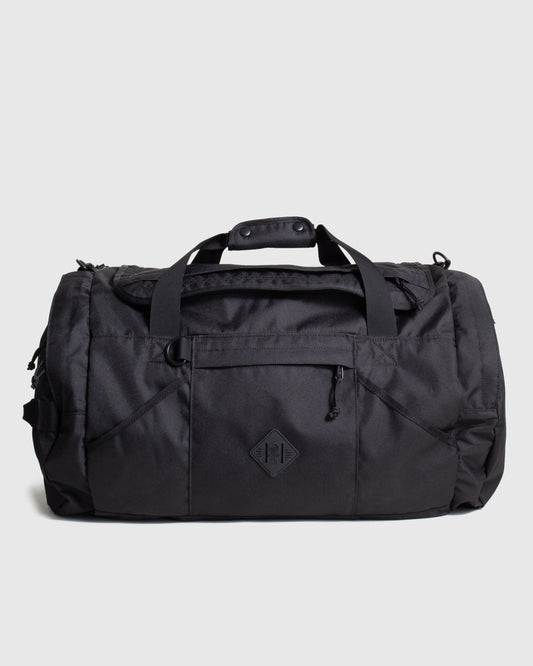
Black - Sold out - $148.00
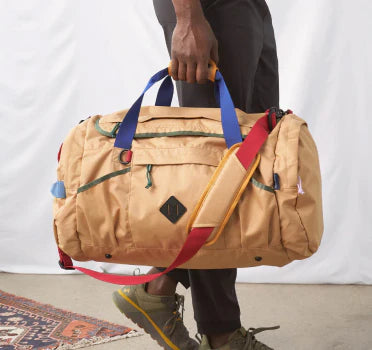
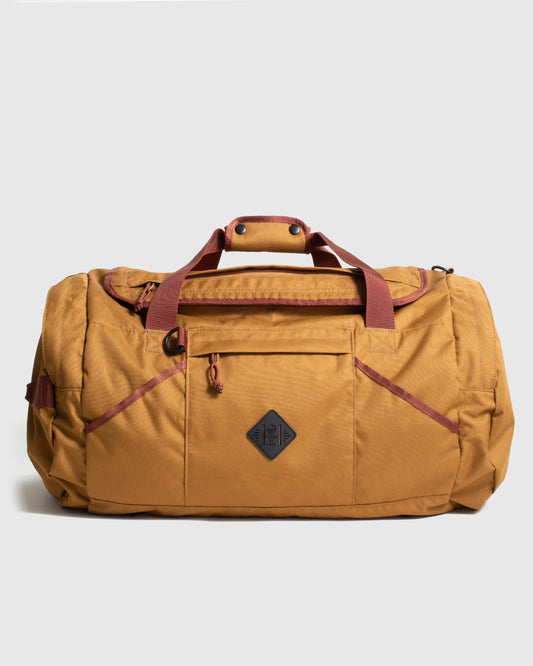
(R)evolution™ 55L Carry-On Duffle
(R)evolution™ 55L Carry-On Duffle
Regular price
$148
Regular price
$148.00
Sale price
$148
Unit price
/
per
Regular price
$148
Regular price
$148.00
Sale price
$148
Unit price
/
per
Regular price
$148
Regular price
$148.00
Sale price
$148
Unit price
/
per
Regular price
$148
Regular price
$148.00
Sale price
$148
Unit price
/
per
Out of stock
ADD TO WISHLIST
CONTINUE SHOPPING
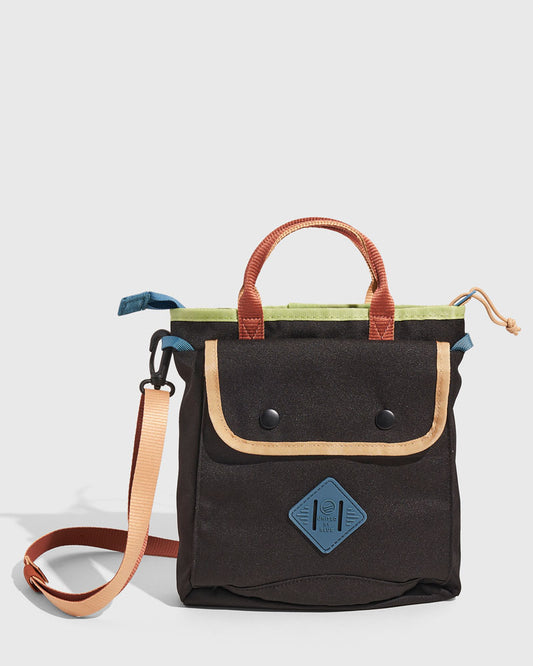
Product variants
Black Multi - $68.00
Mauve - $68.00
(R)evolution™ 3.5L Mini Tote
(R)evolution™ 3.5L Mini Tote
Regular price
$68
Regular price
Sale price
$68
Unit price
/
per
Regular price
$68
Regular price
Sale price
$68
Unit price
/
per
ADD TO WISHLIST
CONTINUE SHOPPING
Product variants
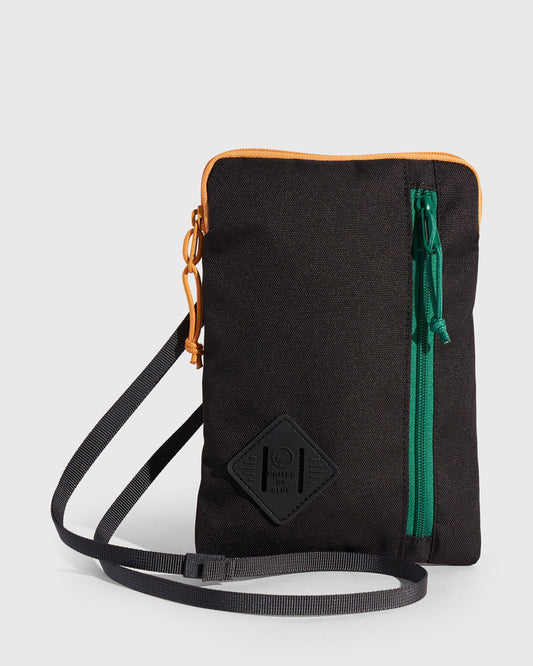
Black Multi - $38.00
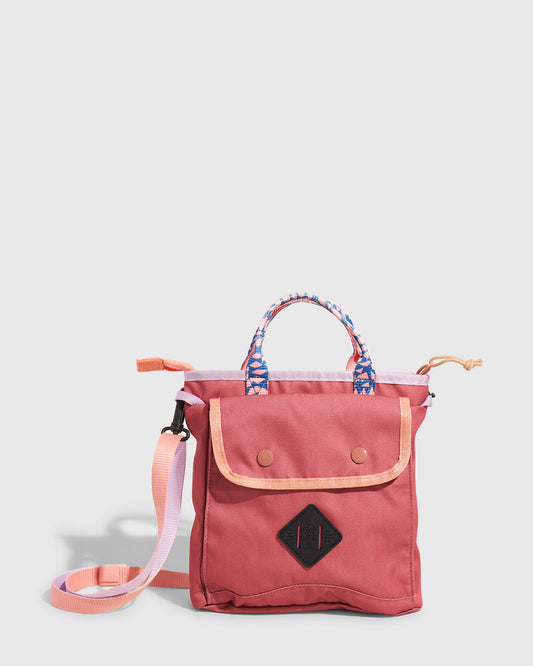
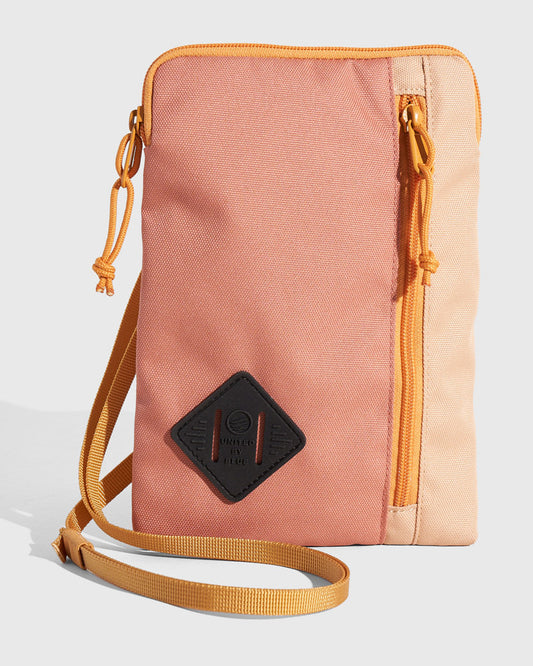
Salmon - $38.00
Light Aqua - Sold out - $38.00
Deadstock (R)evolution™ Transport Pouch
Deadstock (R)evolution™ Transport Pouch
Regular price
$38
Regular price
$0.00
Sale price
$38
Unit price
/
per
Regular price
$38
Regular price
$0.00
Sale price
$38
Unit price
/
per
Regular price
$38
Regular price
$0.00
Sale price
$38
Unit price
/
per
Out of stock
ADD TO WISHLIST
CONTINUE SHOPPING
Product variants
Camel - $98.00
Navy - $98.00
Burnt Sienna - Sold out - $98.00
Cardinal - Sold out - $98.00
Eggplant - Sold out - $98.00
Black - Sold out - $98.00
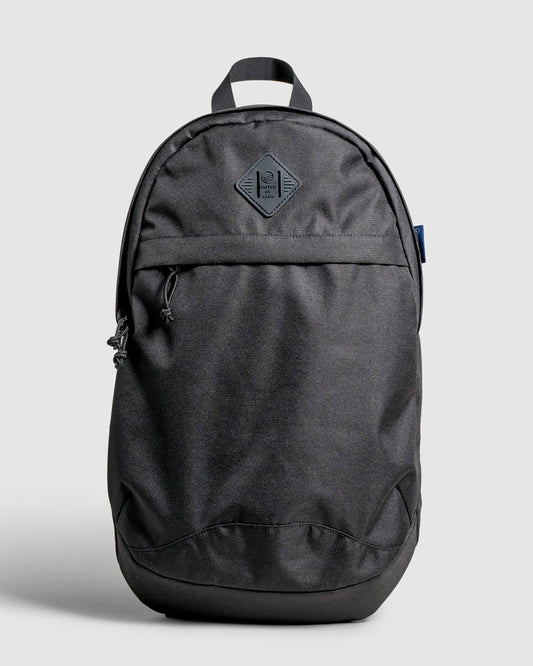
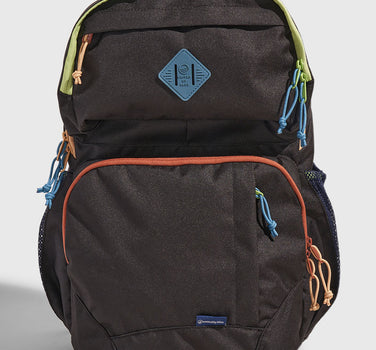
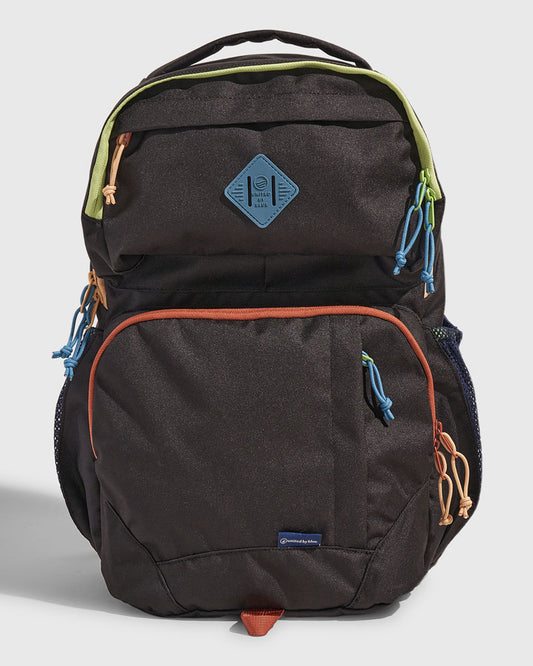
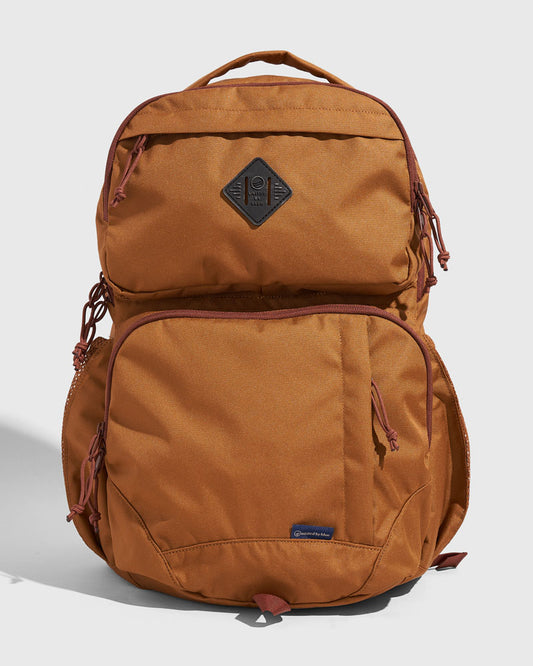
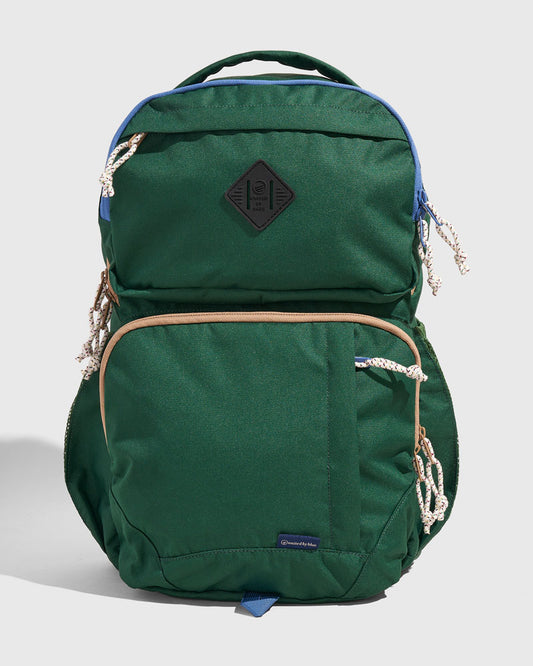
(R)evolution™ 15L Commuter Backpack
Selling Fast
(R)evolution™ 15L Commuter Backpack
Regular price
$98
Regular price
$98.00
Sale price
$98
Unit price
/
per
Regular price
$98
Regular price
$98.00
Sale price
$98
Unit price
/
per
Regular price
$98
Regular price
$98.00
Sale price
$98
Unit price
/
per
Regular price
$98
Regular price
$98.00
Sale price
$98
Unit price
/
per
Regular price
$98
Regular price
$98.00
Sale price
$98
Unit price
/
per
Regular price
$98
Regular price
$98.00
Sale price
$98
Unit price
/
per
Out of stock
Out of stock
Out of stock
Out of stock
ADD TO WISHLIST
CONTINUE SHOPPING
Product variants
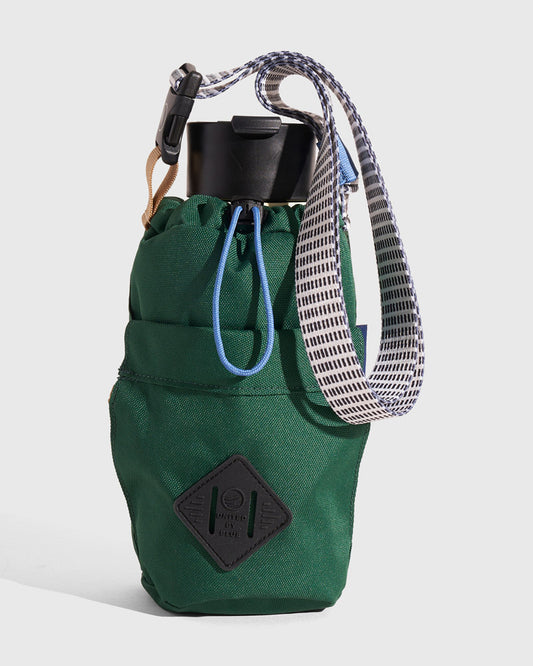
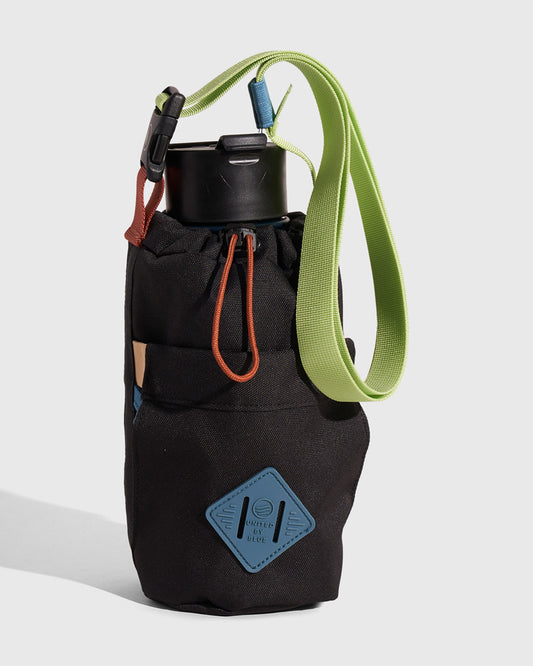
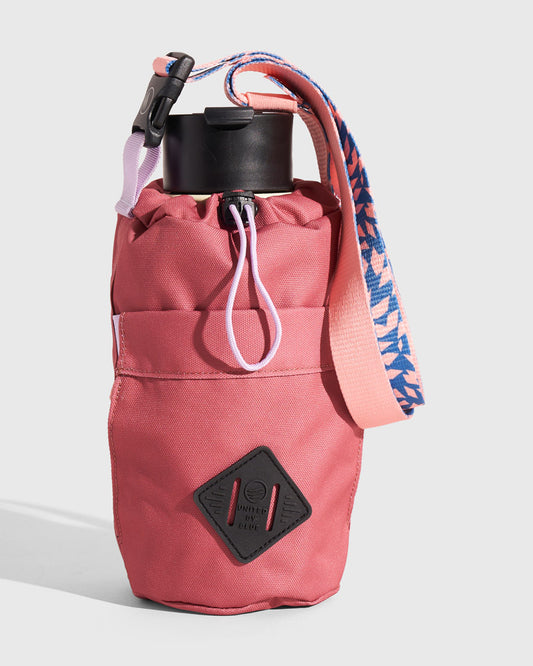
Pine - $38.00
Black Multi - $38.00
Mauve - $38.00
(R)evolution™ Water Bottle Sling
(R)evolution™ Water Bottle Sling
Regular price
$38
Regular price
Sale price
$38
Unit price
/
per
Regular price
$38
Regular price
Sale price
$38
Unit price
/
per
Regular price
$38
Regular price
Sale price
$38
Unit price
/
per
ADD TO WISHLIST
CONTINUE SHOPPING
Product variants
Olive - $98.00
Maroon Aqua - Sold out - $98.00
Black - Sold out - $98.00
Salmon - Sold out - $98.00
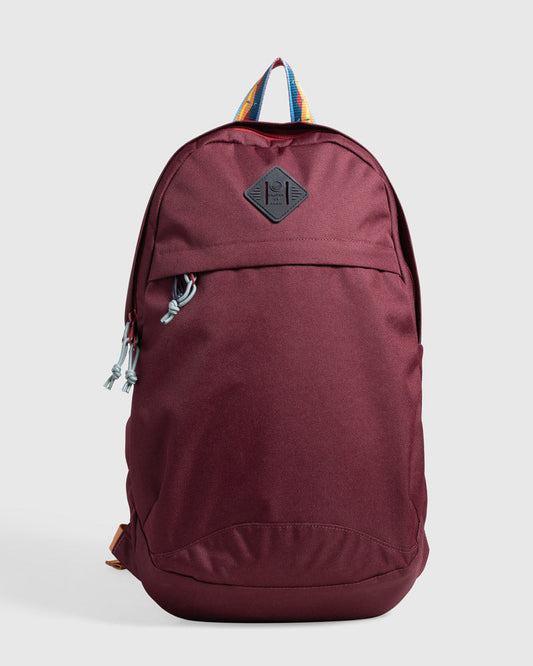
Deadstock (R)evolution™ 9L Sidekick
Deadstock (R)evolution™ 9L Sidekick
Regular price
$98
Regular price
$98.00
Sale price
$98
Unit price
/
per
Regular price
$98
Regular price
$98.00
Sale price
$98
Unit price
/
per
Regular price
$98
Regular price
$98.00
Sale price
$98
Unit price
/
per
Regular price
$98
Regular price
$98.00
Sale price
$98
Unit price
/
per
Out of stock
Out of stock
Out of stock
ADD TO WISHLIST
CONTINUE SHOPPING
Product variants
Blueberry - $64.00
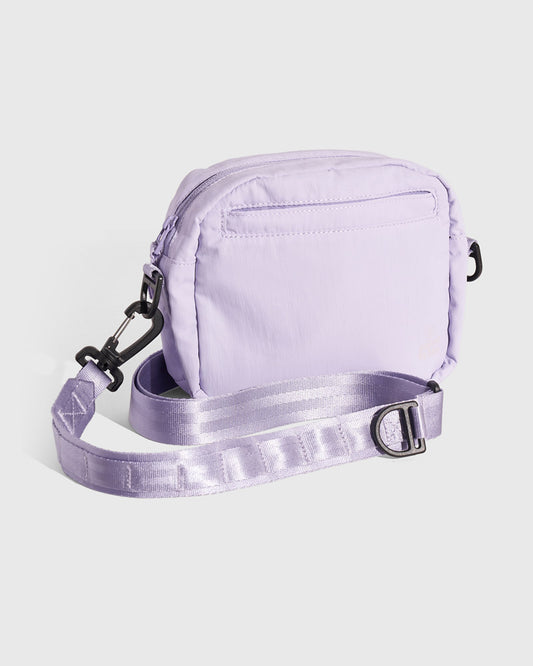
Lavender - $64.00
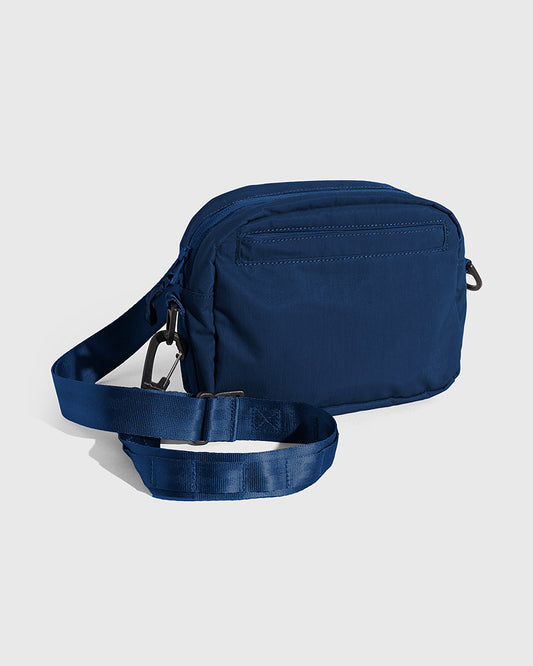
Deep Sea - $64.00
Smoky Ochre - $64.00
(Re)active™ 2L Convertible Crossbody
(Re)active™ 2L Convertible Crossbody
Regular price
$64
Regular price
$0.00
Sale price
$64
Unit price
/
per
Regular price
$64
Regular price
$0.00
Sale price
$64
Unit price
/
per
Regular price
$64
Regular price
$0.00
Sale price
$64
Unit price
/
per
Regular price
$64
Regular price
$0.00
Sale price
$64
Unit price
/
per
1
/
of
10
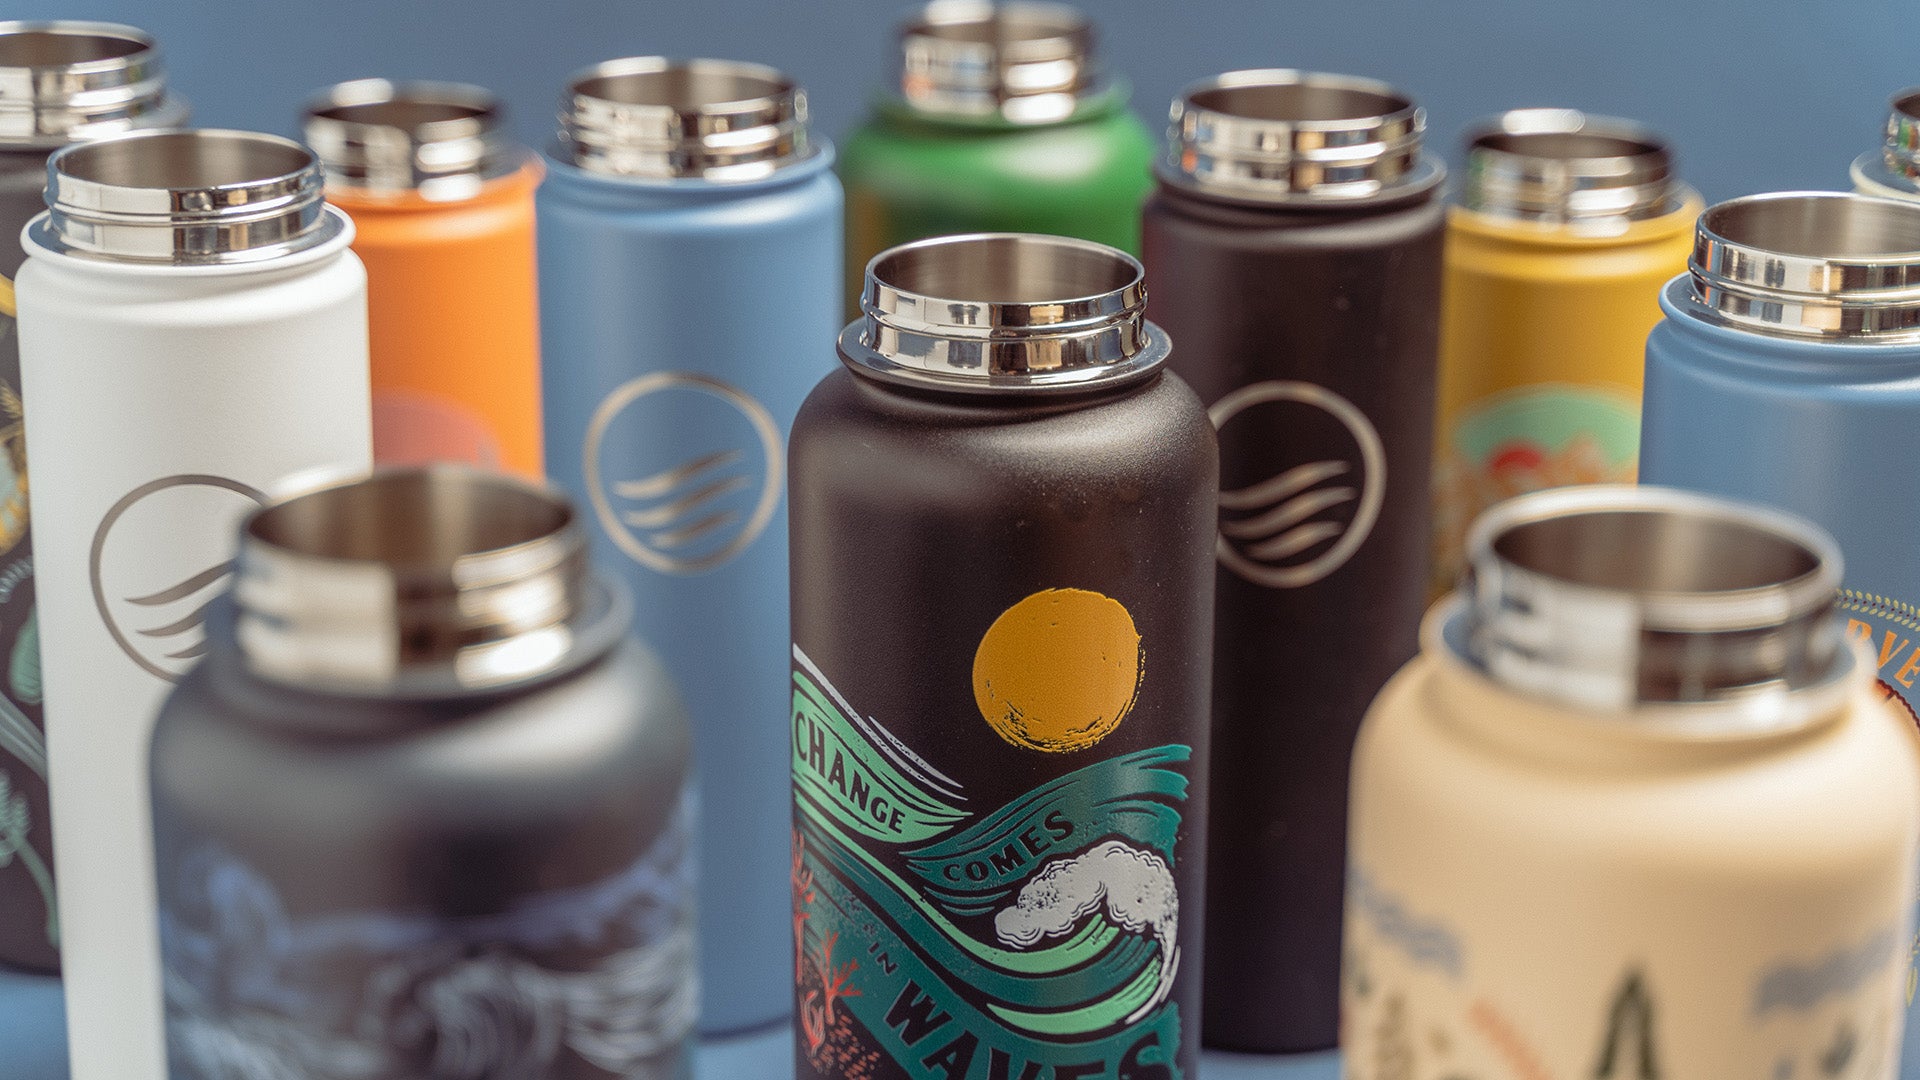
View all
Insulated Bottles
ADD TO WISHLIST
CONTINUE SHOPPING
Product variants
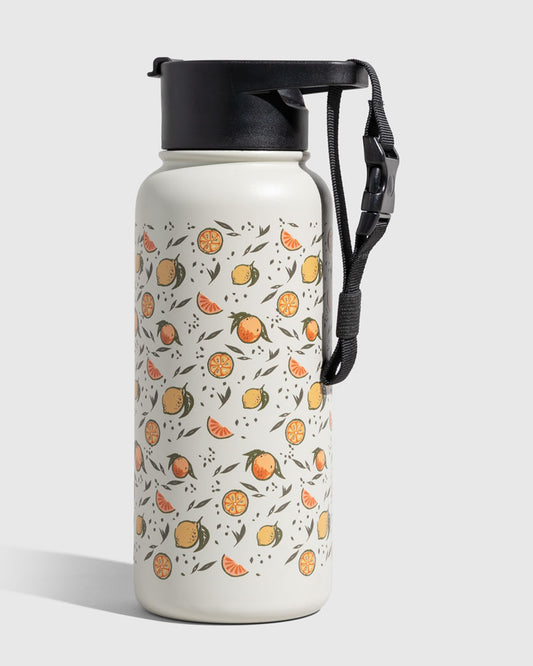
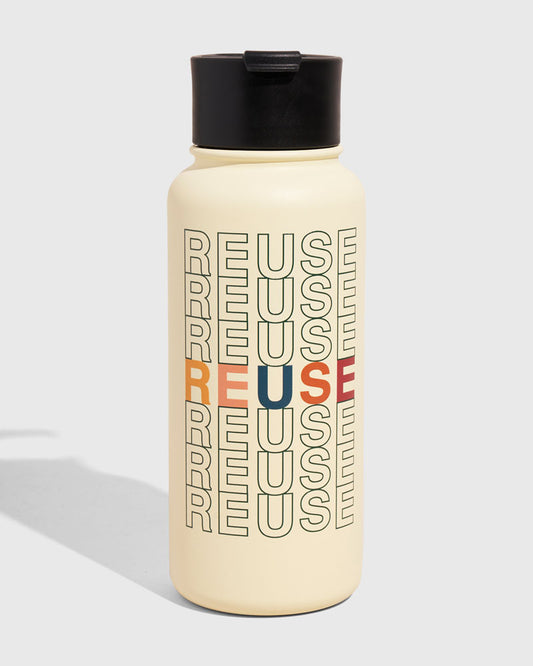
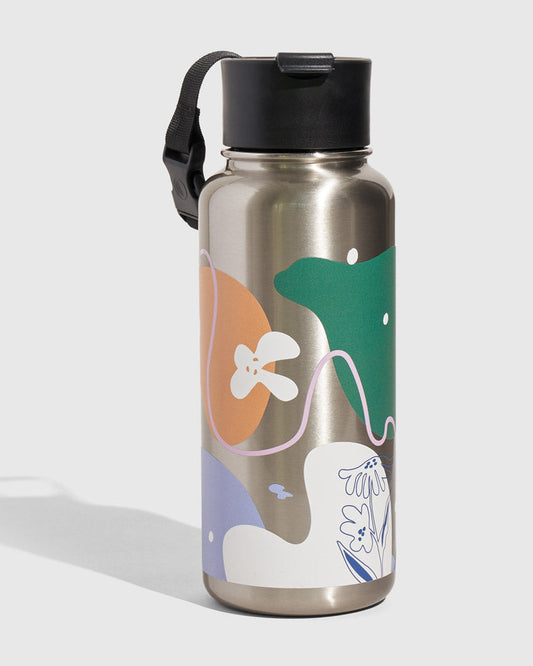
Eggshell - Reuse - $44.00
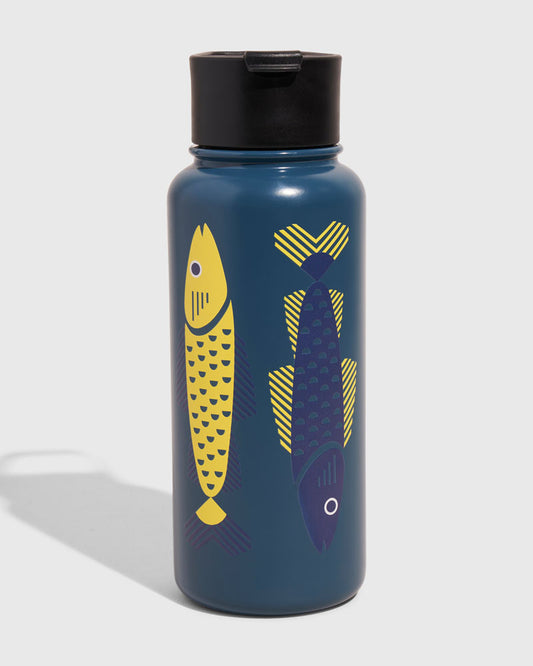
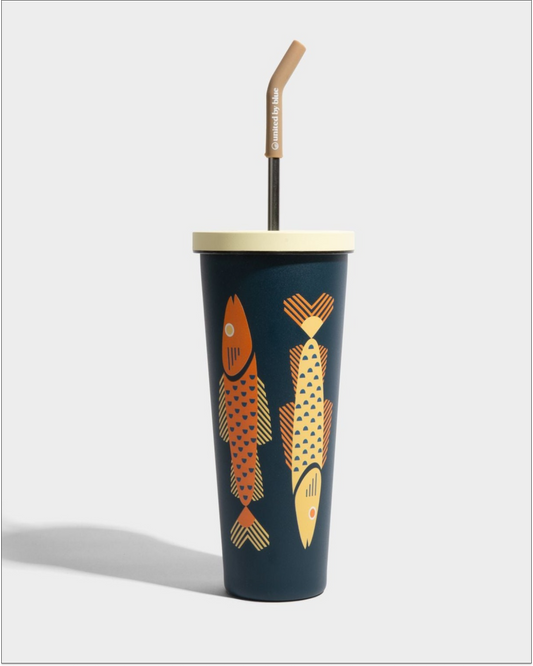
Rainstorm - Fish - $44.00
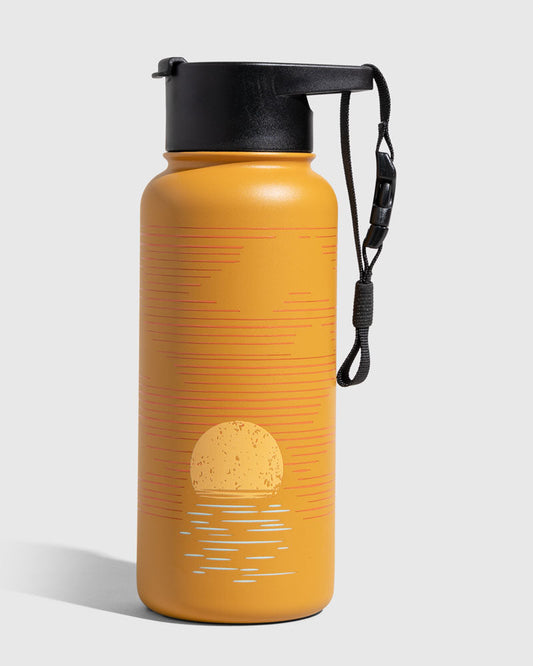
Caramel - $44.00
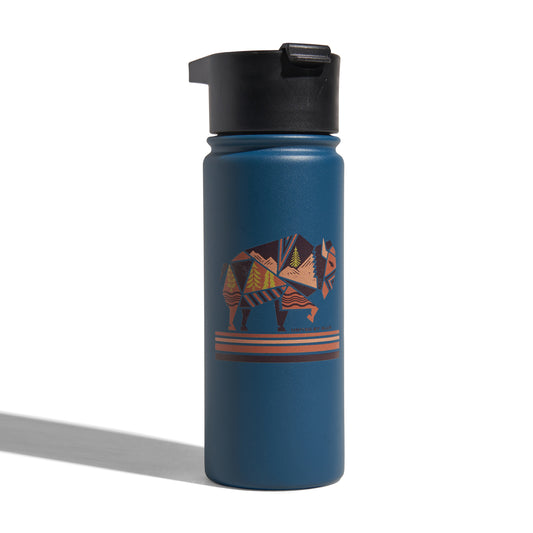
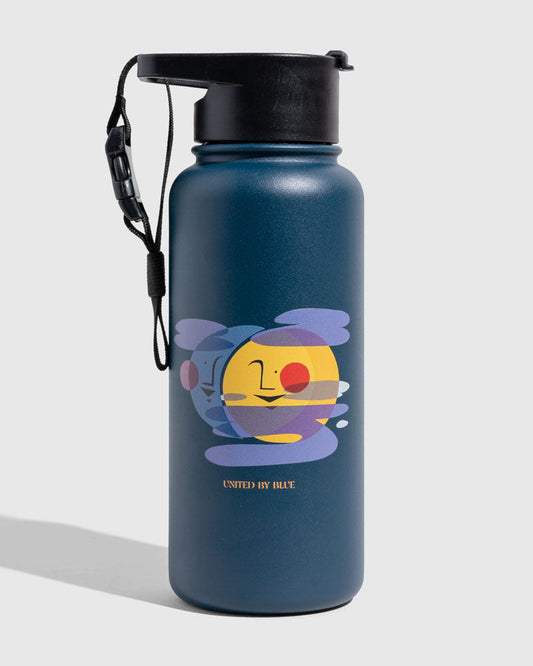
Deep Blue - $44.00
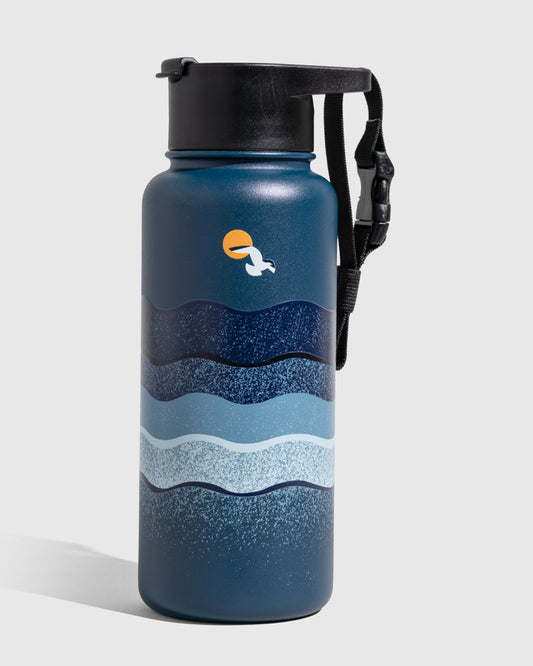
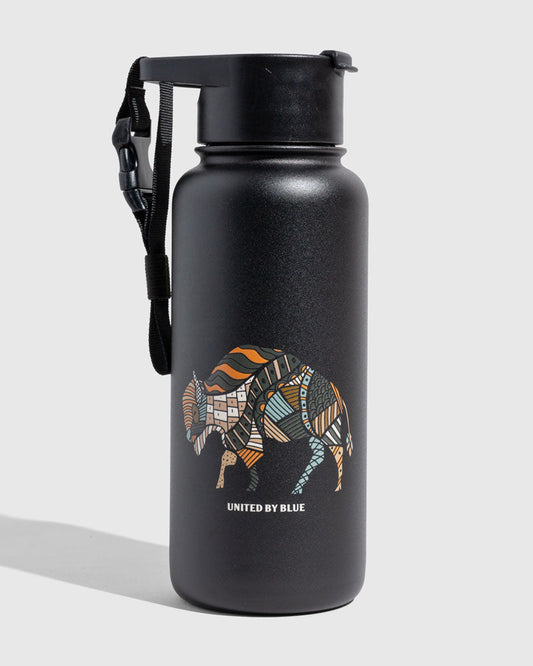
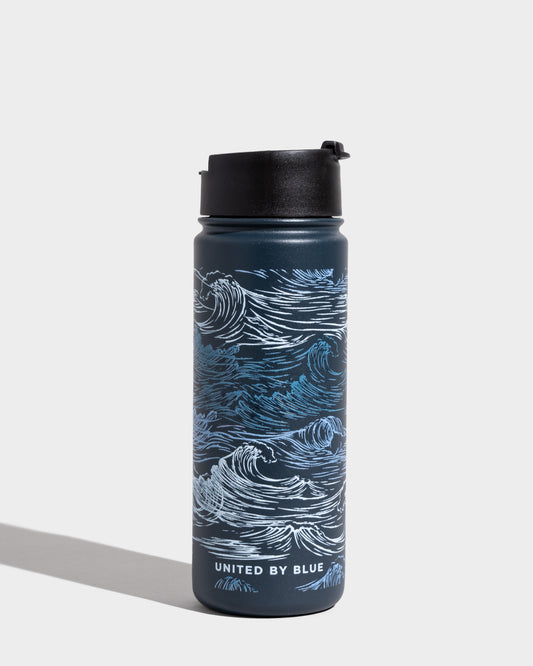
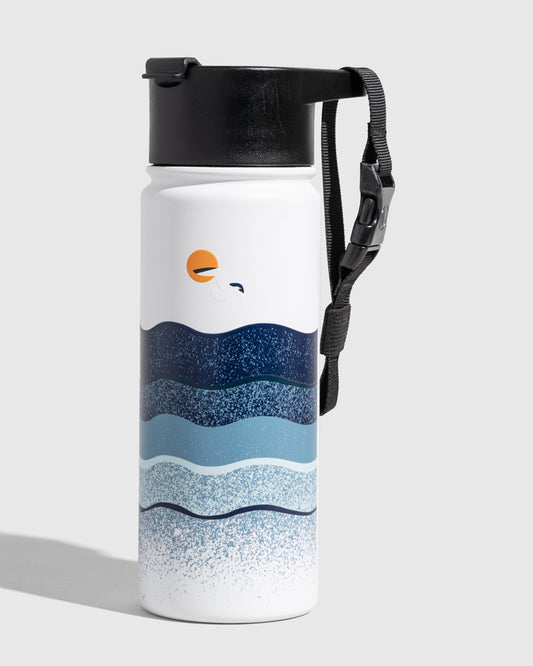
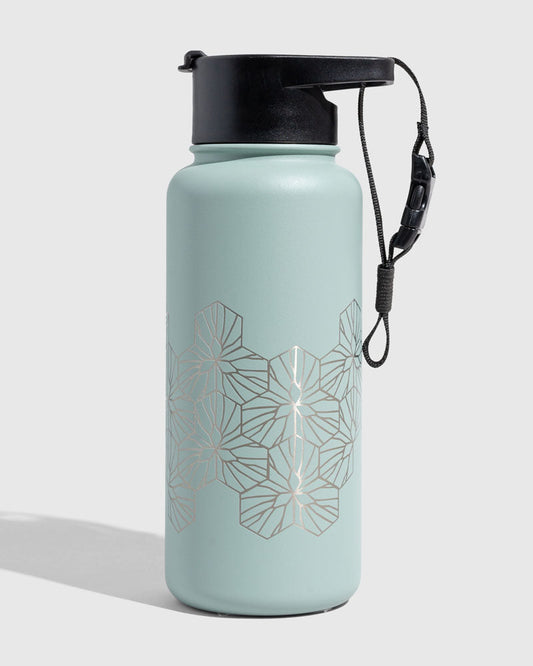
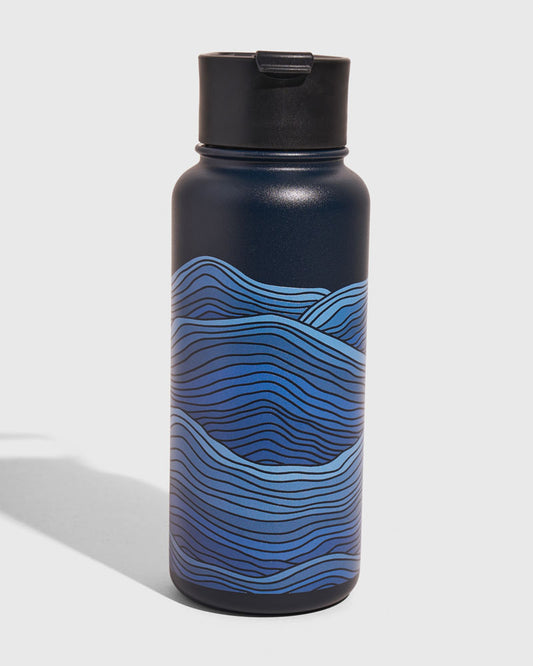
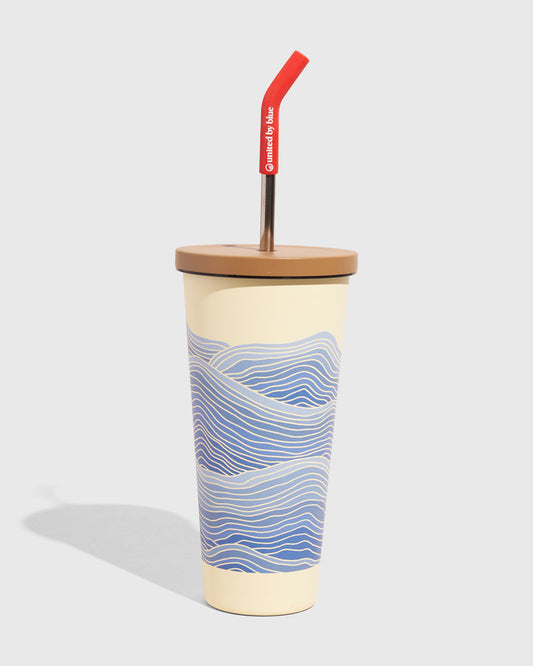
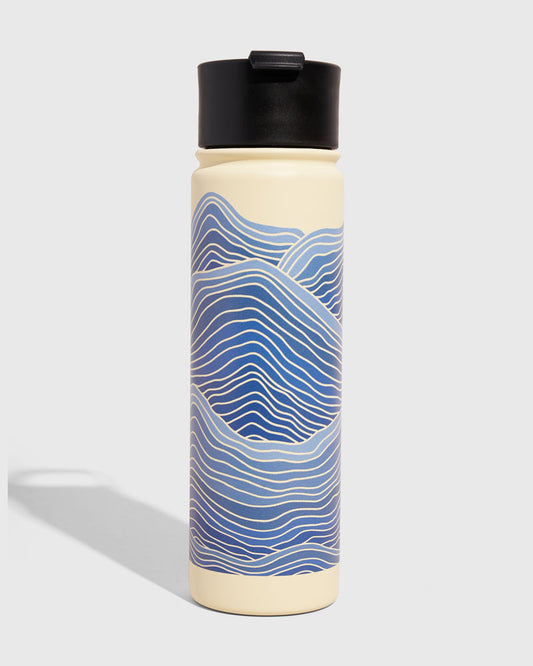
Lake - Waves - $44.00
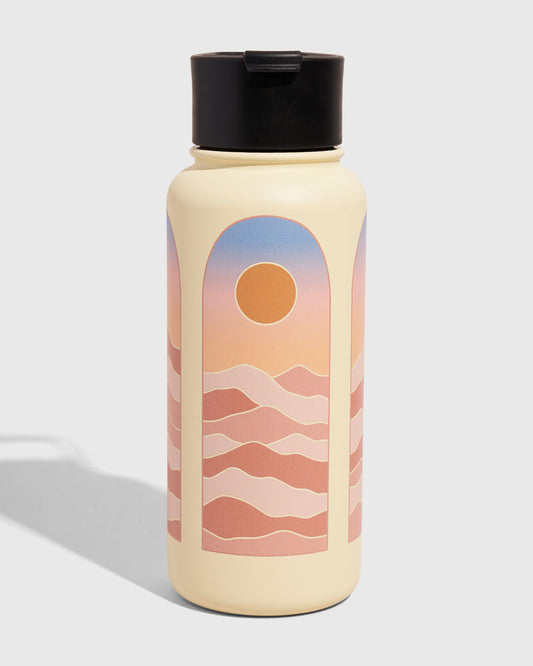
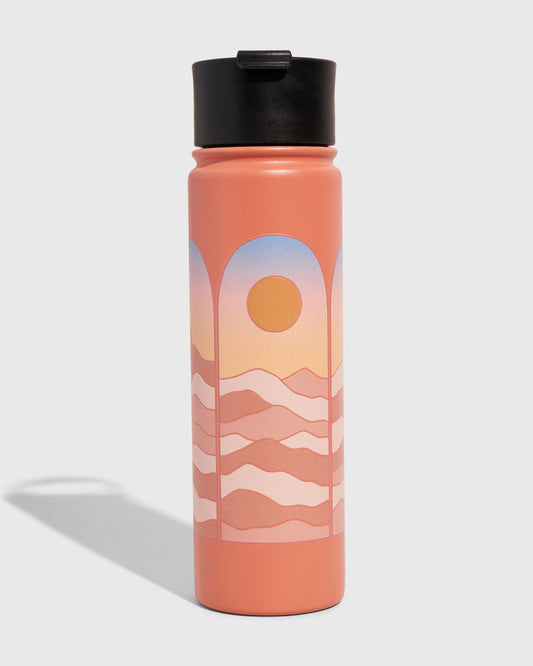
Eggshell - Sunrise - $44.00
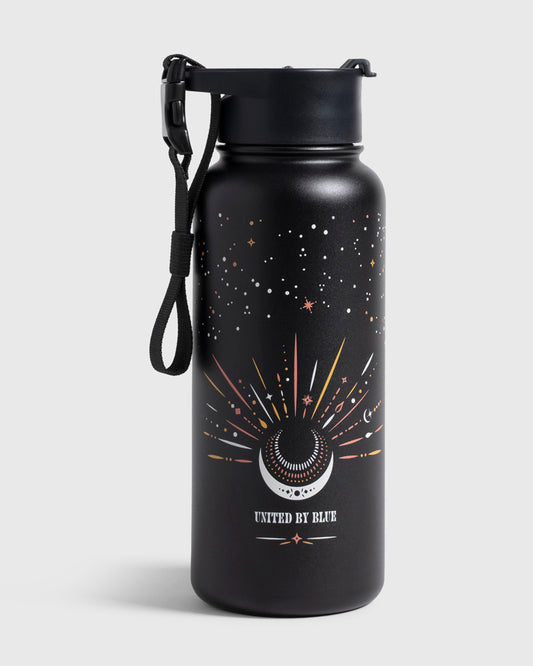
Black - Ink - $44.00
Illuminate - $44.00
Black - Celestial - Sold out - $44.00
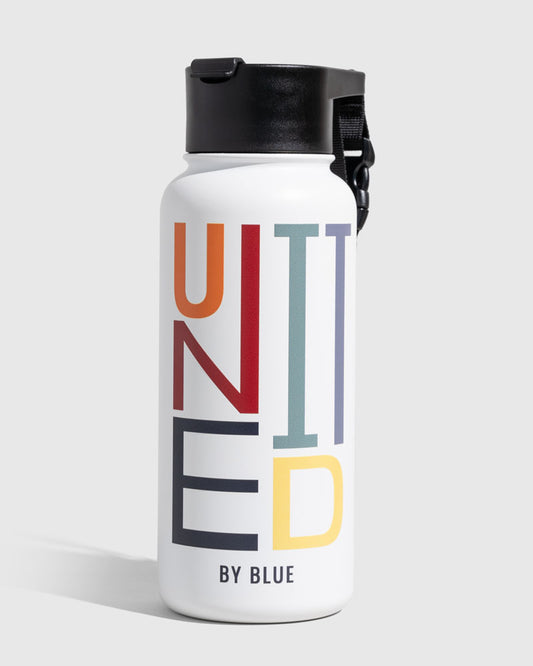
White - United - Sold out - $44.00
Insulated Steel Bottle 32 Oz.
Insulated Steel Bottle 32 Oz.
Regular price
$44
Regular price
$44.00
Sale price
$44
Unit price
/
per
Regular price
$44
Regular price
$44.00
Sale price
$44
Unit price
/
per
Regular price
$44
Regular price
$44.00
Sale price
$44
Unit price
/
per
Regular price
$44
Regular price
$44.00
Sale price
$44
Unit price
/
per
Regular price
$44
Regular price
$44.00
Sale price
$44
Unit price
/
per
Regular price
$44
Regular price
$44.00
Sale price
$44
Unit price
/
per
Regular price
$44
Regular price
$44.00
Sale price
$44
Unit price
/
per
Regular price
$44
Regular price
$44.00
Sale price
$44
Unit price
/
per
Regular price
$44
Regular price
$44.00
Sale price
$44
Unit price
/
per
Regular price
$44
Regular price
$44.00
Sale price
$44
Unit price
/
per
Out of stock
Out of stock
ADD TO WISHLIST
CONTINUE SHOPPING
Product variants
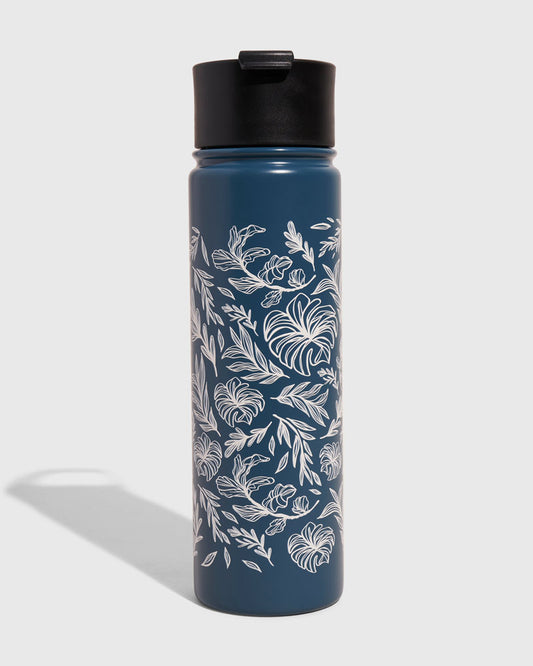
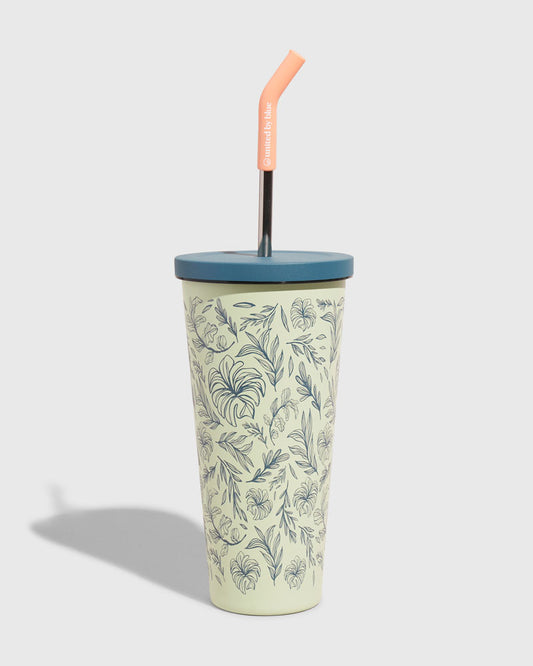
Rainstorm - Plants - $34.00
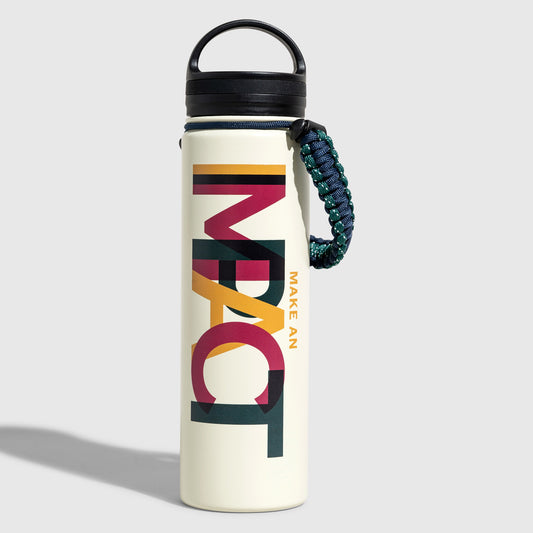
Make An Impact - $34.00
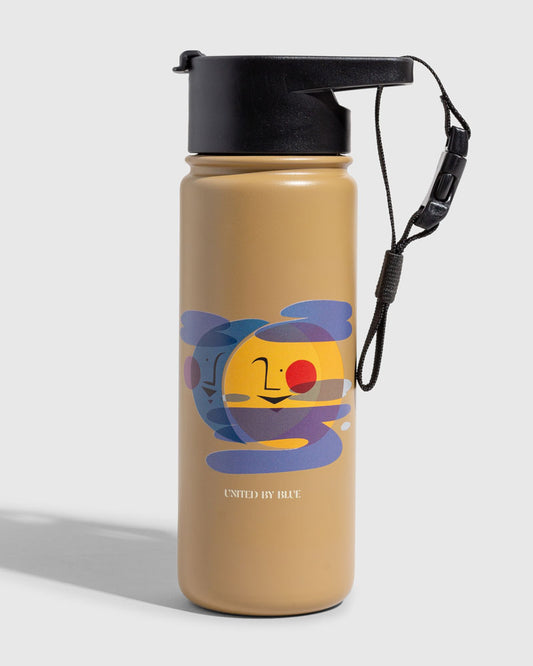
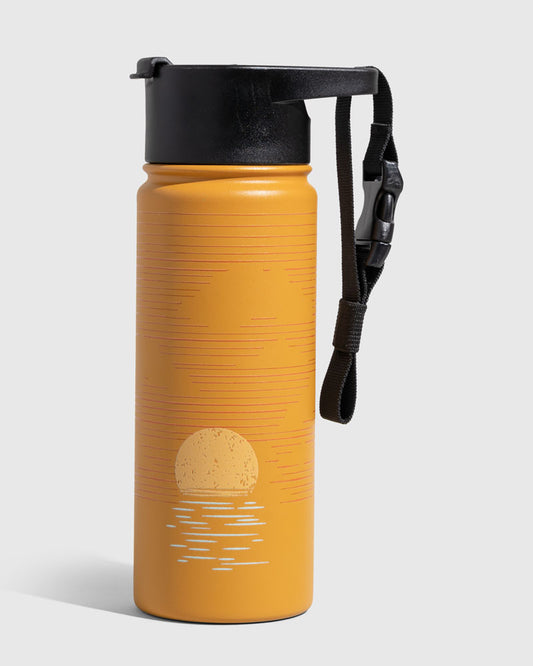
Sherbet - Sunrise - $34.00
Eggshell - Waves - $34.00
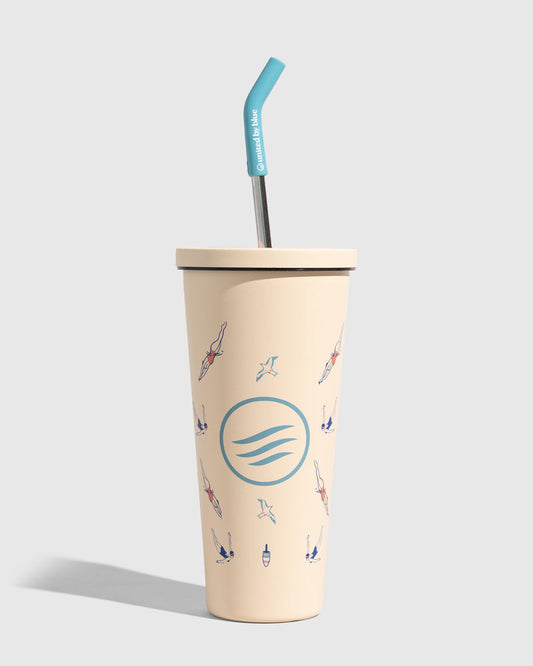
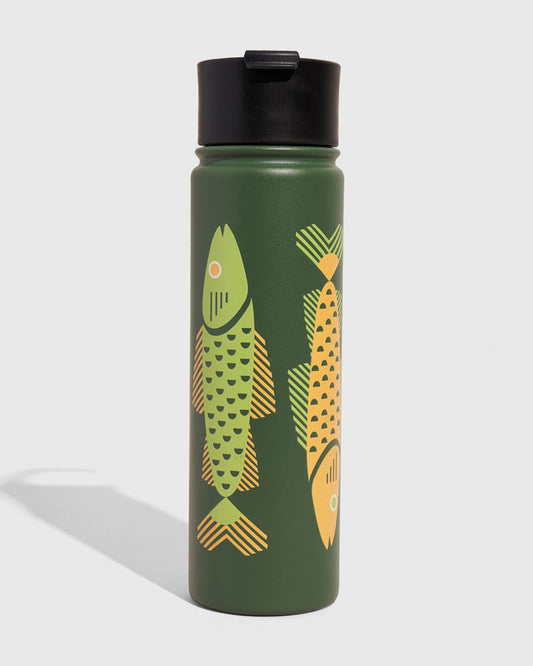
Pine - Fish - $34.00
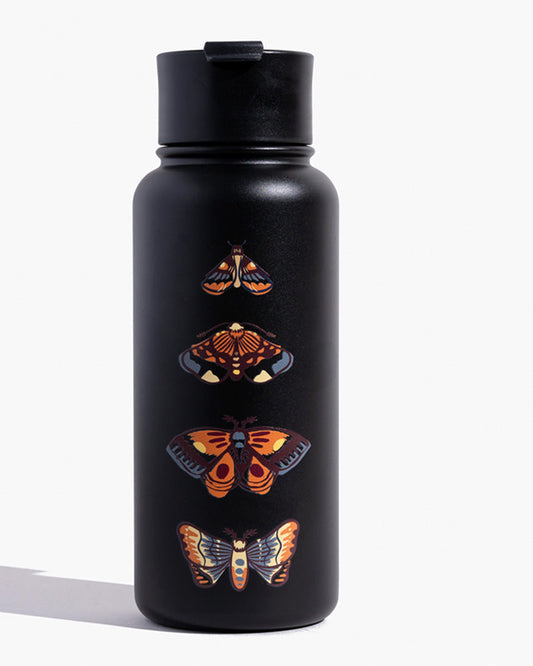
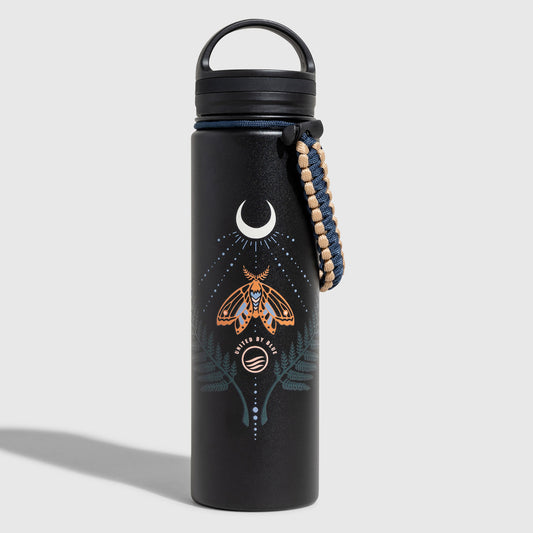
Lunar Moth - $34.00
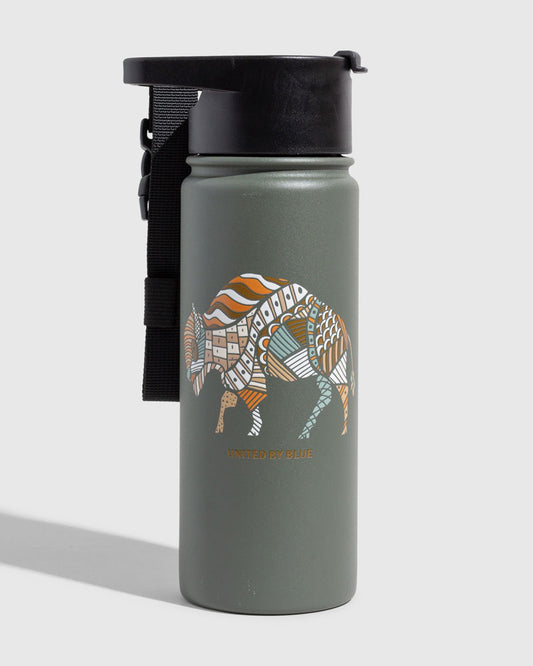
Insulated Steel Bottle 22 Oz.
Insulated Steel Bottle 22 Oz.
Regular price
$34
Regular price
$34.00
Sale price
$34
Unit price
/
per
Regular price
$34
Regular price
$34.00
Sale price
$34
Unit price
/
per
Regular price
$34
Regular price
$34.00
Sale price
$34
Unit price
/
per
Regular price
$34
Regular price
$34.00
Sale price
$34
Unit price
/
per
Regular price
$34
Regular price
$34.00
Sale price
$34
Unit price
/
per
Regular price
$34
Regular price
$34.00
Sale price
$34
Unit price
/
per
ADD TO WISHLIST
CONTINUE SHOPPING
Product variants
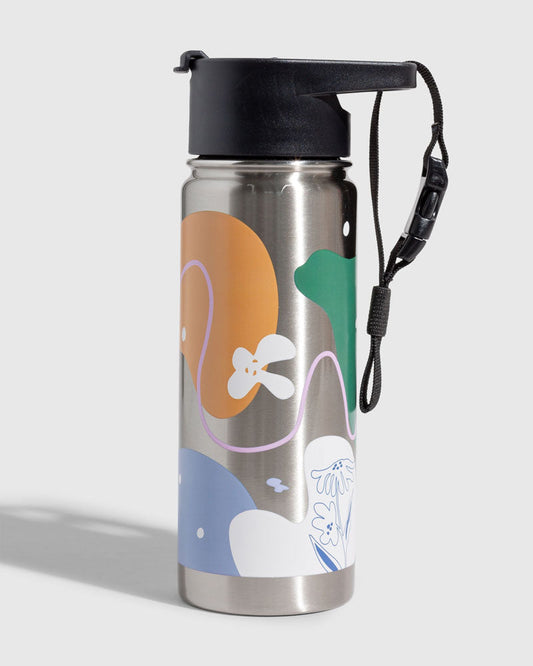
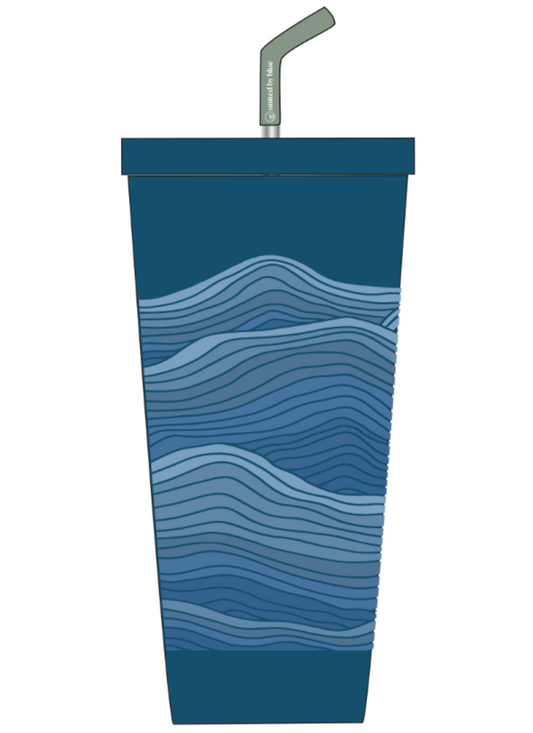
Eggshell - Waves - $34.00
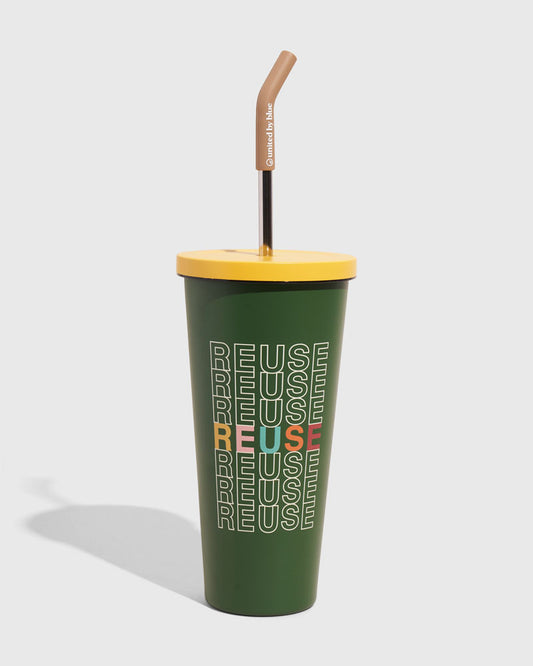
Pine - REUSE - $34.00
Pale Pink - $34.00
Rainstorm - Fish - $34.00
Seafoam - $34.00
Lake- Waves - $34.00
Cocoa - Sold out - $34.00
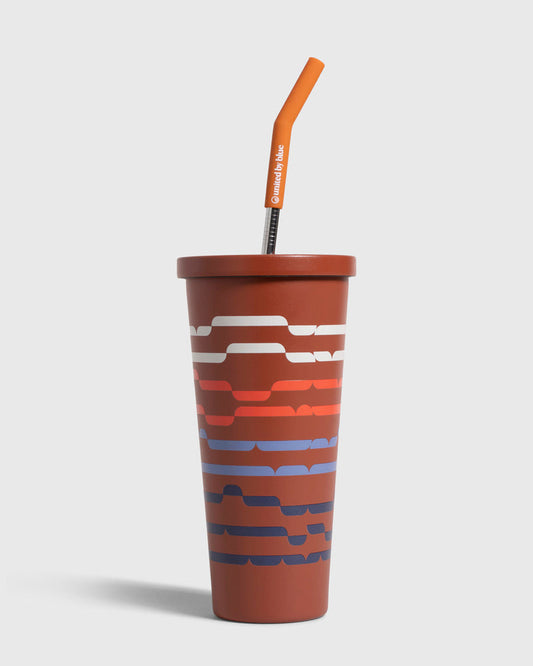
24 oz Insulated Steel Straw Tumbler
24 oz Insulated Steel Straw Tumbler
Regular price
$34
Regular price
$34.00
Sale price
$34
Unit price
/
per
Regular price
$34
Regular price
$34.00
Sale price
$34
Unit price
/
per
Regular price
$34
Regular price
$34.00
Sale price
$34
Unit price
/
per
Regular price
$34
Regular price
$34.00
Sale price
$34
Unit price
/
per
Regular price
$34
Regular price
$34.00
Sale price
$34
Unit price
/
per
Regular price
$34
Regular price
$34.00
Sale price
$34
Unit price
/
per
Regular price
$34
Regular price
$34.00
Sale price
$34
Unit price
/
per
Out of stock
ADD TO WISHLIST
CONTINUE SHOPPING
Product variants
Grey - $28.00
Alpine Blue - $28.00
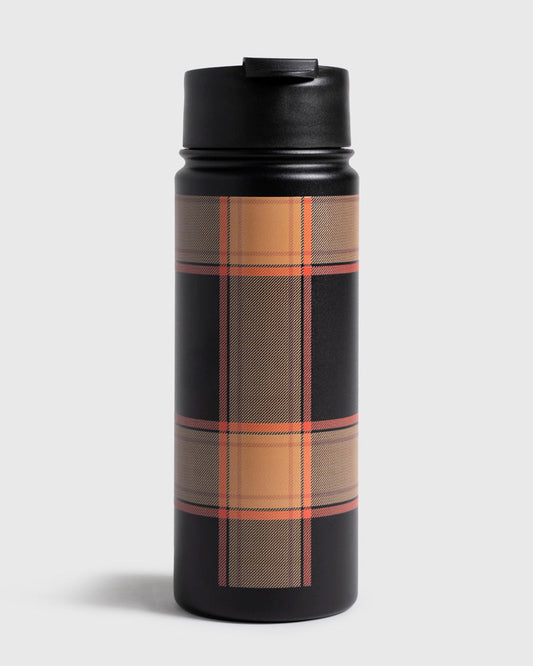
Plaid - Sold out - $28.00
Illuminate - Sold out - $28.00
Smoky Ochre - Sold out - $28.00
Insulated Steel Bottle 18 Oz.
Only 2 Left
Insulated Steel Bottle 18 Oz.
Regular price
$28
Regular price
$28.00
Sale price
$28
Unit price
/
per
Regular price
$28
Regular price
$28.00
Sale price
$28
Unit price
/
per
Regular price
$28
Regular price
$28.00
Sale price
$28
Unit price
/
per
Regular price
$28
Regular price
$28.00
Sale price
$28
Unit price
/
per
Regular price
$28
Regular price
$28.00
Sale price
$28
Unit price
/
per
Out of stock
Out of stock
Out of stock
ADD TO WISHLIST
CONTINUE SHOPPING
Product variants
Night Sky - $44.00
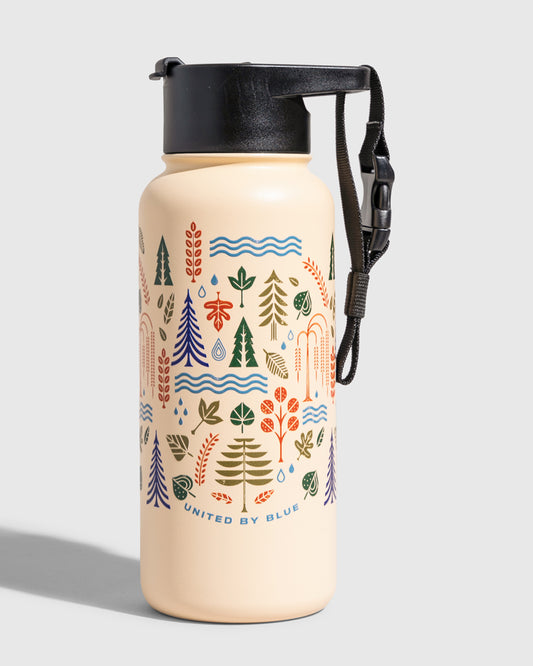
Citrus Ivory - $44.00
Blush - Sold out - $44.00
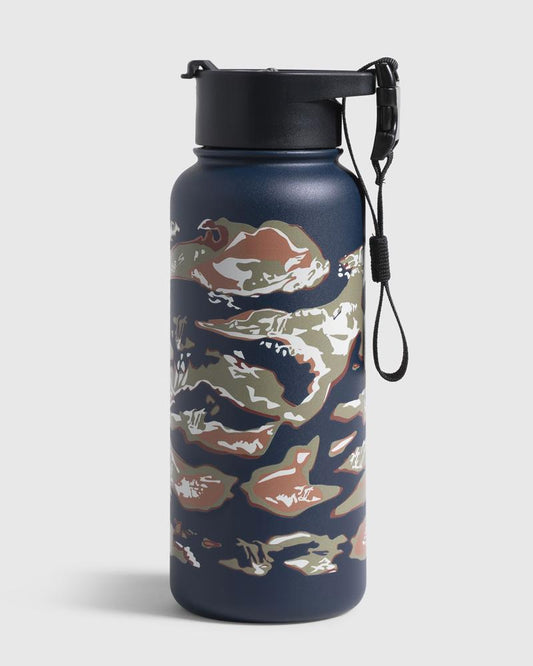
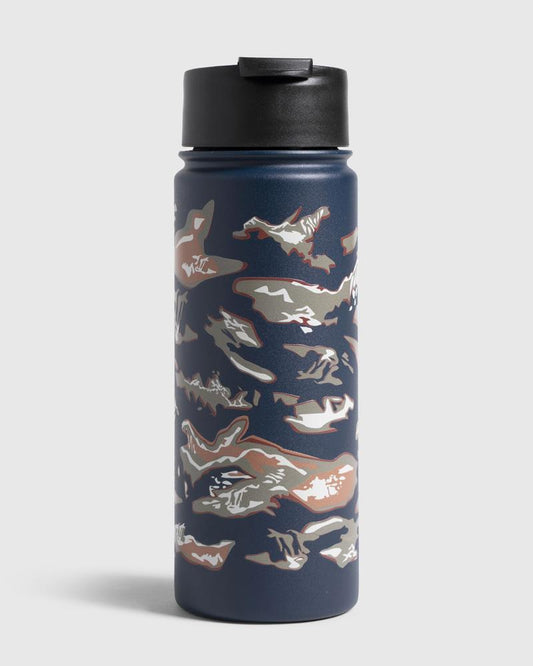
Lakeside Camo - Sold out - $44.00
Black Ink - Sold out - $44.00
Insulated Steel Bottle 32 Oz.
Selling Fast
Insulated Steel Bottle 32 Oz.
Regular price
$44
Regular price
$44.00
Sale price
$44
Unit price
/
per
Regular price
$44
Regular price
$44.00
Sale price
$44
Unit price
/
per
Regular price
$44
Regular price
$44.00
Sale price
$44
Unit price
/
per
Regular price
$44
Regular price
$44.00
Sale price
$44
Unit price
/
per
Regular price
$44
Regular price
$44.00
Sale price
$44
Unit price
/
per
Out of stock
Out of stock
Out of stock
ADD TO WISHLIST
CONTINUE SHOPPING
Product variants
Caramel - Sold out - $28.00
Lakeside Camo - Sold out - $28.00
Navy - Sold out - $28.00
White - $28.00
Insulated Travel Mug 18 Oz.
Only 5 Left
Insulated Travel Mug 18 Oz.
Regular price
$28
Regular price
$28.00
Sale price
$28
Unit price
/
per
Regular price
$28
Regular price
$28.00
Sale price
$28
Unit price
/
per
Regular price
$28
Regular price
$28.00
Sale price
$28
Unit price
/
per
Regular price
$28
Regular price
$28.00
Sale price
$28
Unit price
/
per
Out of stock
Out of stock
Out of stock
ADD TO WISHLIST
CONTINUE SHOPPING
Product variants
Eggshell - Waves - $34.00
Rainstorm - Plants - $34.00
Sherbet - Sunrise - $34.00
Pine - Fish - $34.00
Make An Impact - $34.00
Lunar Moth - $34.00
22OZ INSULATED STEEL BOTTLE
22OZ INSULATED STEEL BOTTLE
Regular price
$34
Regular price
$17.00
Sale price
$34
Unit price
/
per
Regular price
$34
Regular price
$17.00
Sale price
$34
Unit price
/
per
Regular price
$34
Regular price
$17.00
Sale price
$34
Unit price
/
per
Regular price
$34
Regular price
$17.00
Sale price
$34
Unit price
/
per
Regular price
$34
Regular price
$17.00
Sale price
$34
Unit price
/
per
Regular price
$34
Regular price
$17.00
Sale price
$34
Unit price
/
per
ADD TO WISHLIST
CONTINUE SHOPPING
Product variants
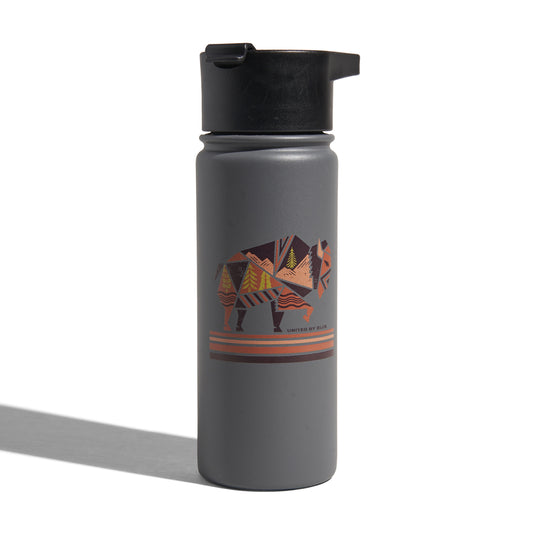
Steel Grey - Sold out - $28.00
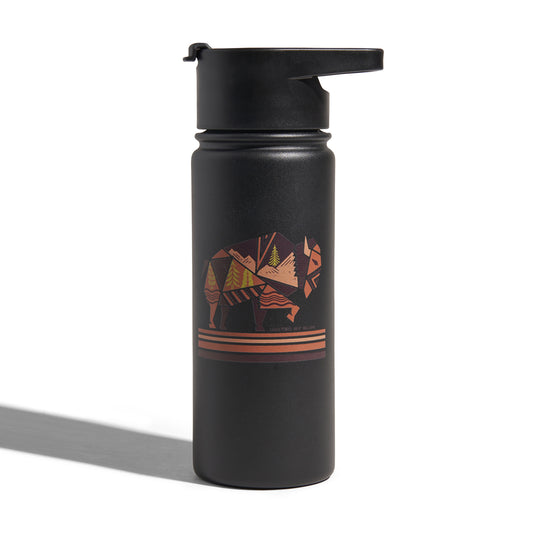
Black - Sold out - $28.00
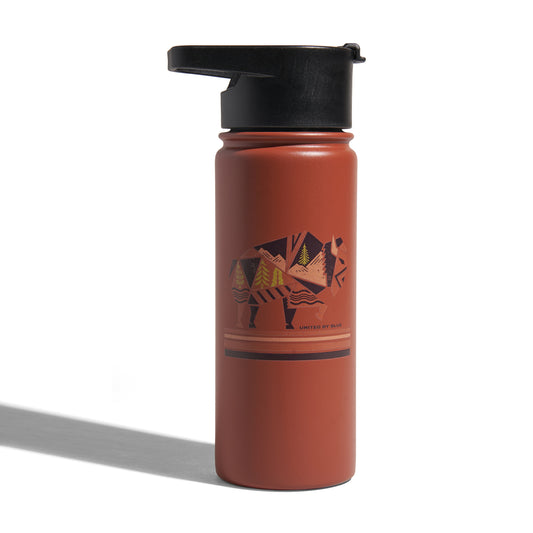
Cocoa - Sold out - $28.00
Alpine Blue - $28.00
Geo Bison 18 Oz. Insulated Travel Mug
Only 1 Left
Geo Bison 18 Oz. Insulated Travel Mug
Regular price
$28
Sale price
$28
Unit price
/
per
Regular price
$28
Sale price
$28
Unit price
/
per
Regular price
$28
Sale price
$28
Unit price
/
per
Regular price
$28
Sale price
$28
Unit price
/
per
Out of stock
Out of stock
Out of stock
ADD TO WISHLIST
CONTINUE SHOPPING
Product variants
Black Ink - Sold out - $44.00
Juniper - Sold out - $44.00
Ebony - $44.00
Insulated Steel Bottle 32 Oz.
Only 5 Left
Insulated Steel Bottle 32 Oz.
Regular price
$44
Regular price
$44.00
Sale price
$44
Unit price
/
per
Regular price
$44
Regular price
$44.00
Sale price
$44
Unit price
/
per
Regular price
$44
Regular price
$44.00
Sale price
$44
Unit price
/
per
Out of stock
Out of stock
1
/
of
9
No Dirty Business
Our manufacturing partners hold some of the highest standards in social and environmental responsibility with the certifications to back them up.
Ethical Manufacturing
SELECT A SIZE & COLOR:
Choosing a selection results in a full page refresh.